

5.4 Going Further: From Linear Stability Analysis to Oscillation Regimes
267
corresponding to these measurements, with the successive tasks – singing, playing,
multiphonic – successively appearing on each spectrogram.
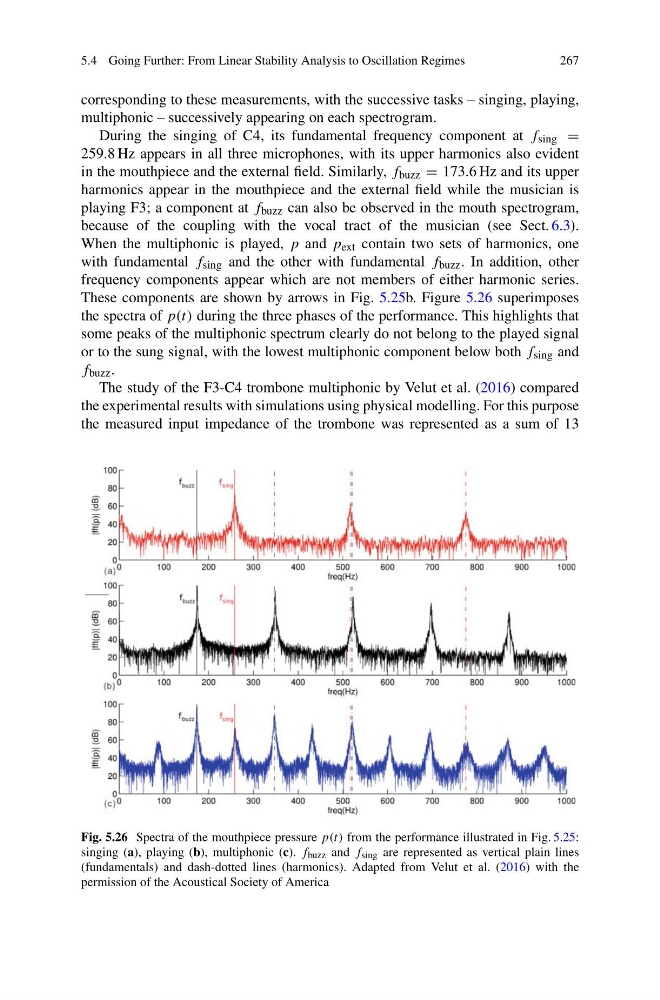
During the singing of C4, its fundamental frequency component at f sing =
259.8 Hz appears in all three microphones, with its upper harmonics also evident
in the mouthpiece and the external field. Similarly, f buzz = 173.6 Hz and its upper
harmonics appear in the mouthpiece and the external field while the musician is
playing F3; a component at f buzz can also be observed in the mouth spectrogram,
because of the coupling with the vocal tract of the musician (see Sect. 6.3).
When the multiphonic is played, p and p ext contain two sets of harmonics, one
with fundamental f sing and the other with fundamental f buzz . In addition, other
frequency components appear which are not members of either harmonic series.
These components are shown by arrows in Fig. 5.25b. Figure 5.26 superimposes
the spectra of p(t) during the three phases of the performance. This highlights that
some peaks of the multiphonic spectrum clearly do not belong to the played signal
or to the sung signal, with the lowest multiphonic component below both f sing and
f buzz .
The study of the F3-C4 trombone multiphonic by Velut et al. (2016) compared
the experimental results with simulations using physical modelling. For this purpose
the measured input impedance of the trombone was represented as a sum of 13
Fig. 5.26 Spectra of the mouthpiece pressure p(t) from the performance illustrated in Fig. 5.25:
singing (a), playing (b), multiphonic (c). f buzz and f sing are represented as vertical plain lines
(fundamentals) and dash-dotted lines (harmonics). Adapted from Velut et al. (2016) with the
permission of the Acoustical Society of America
267
corresponding to these measurements, with the successive tasks – singing, playing,
multiphonic – successively appearing on each spectrogram.
During the singing of C4, its fundamental frequency component at f sing =
259.8 Hz appears in all three microphones, with its upper harmonics also evident
in the mouthpiece and the external field. Similarly, f buzz = 173.6 Hz and its upper
harmonics appear in the mouthpiece and the external field while the musician is
playing F3; a component at f buzz can also be observed in the mouth spectrogram,
because of the coupling with the vocal tract of the musician (see Sect. 6.3).
When the multiphonic is played, p and p ext contain two sets of harmonics, one
with fundamental f sing and the other with fundamental f buzz . In addition, other
frequency components appear which are not members of either harmonic series.
These components are shown by arrows in Fig. 5.25b. Figure 5.26 superimposes
the spectra of p(t) during the three phases of the performance. This highlights that
some peaks of the multiphonic spectrum clearly do not belong to the played signal
or to the sung signal, with the lowest multiphonic component below both f sing and
f buzz .
The study of the F3-C4 trombone multiphonic by Velut et al. (2016) compared
the experimental results with simulations using physical modelling. For this purpose
the measured input impedance of the trombone was represented as a sum of 13
Fig. 5.26 Spectra of the mouthpiece pressure p(t) from the performance illustrated in Fig. 5.25:
singing (a), playing (b), multiphonic (c). f buzz and f sing are represented as vertical plain lines
(fundamentals) and dash-dotted lines (harmonics). Adapted from Velut et al. (2016) with the
permission of the Acoustical Society of America