

194
4 After the Lips: Acoustic Resonances and Radiation
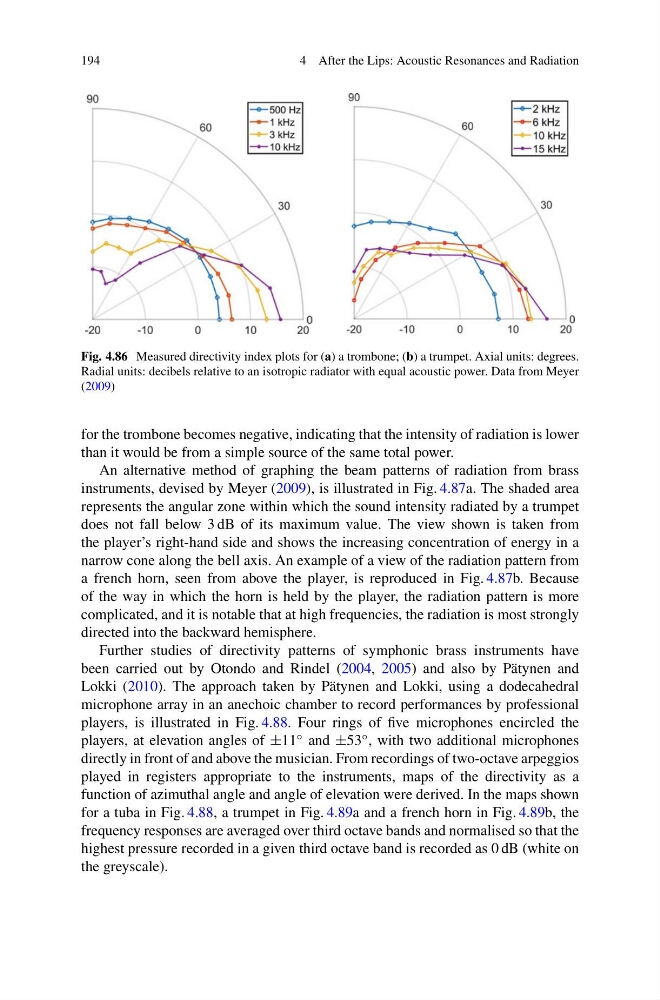
Fig. 4.86 Measured directivity index plots for (a) a trombone; (b) a trumpet. Axial units: degrees.
Radial units: decibels relative to an isotropic radiator with equal acoustic power. Data from Meyer
(2009)
for the trombone becomes negative, indicating that the intensity of radiation is lower
than it would be from a simple source of the same total power.
An alternative method of graphing the beam patterns of radiation from brass
instruments, devised by Meyer (2009), is illustrated in Fig. 4.87a. The shaded area
represents the angular zone within which the sound intensity radiated by a trumpet
does not fall below 3 dB of its maximum value. The view shown is taken from
the player’s right-hand side and shows the increasing concentration of energy in a
narrow cone along the bell axis. An example of a view of the radiation pattern from
a french horn, seen from above the player, is reproduced in Fig. 4.87b. Because
of the way in which the horn is held by the player, the radiation pattern is more
complicated, and it is notable that at high frequencies, the radiation is most strongly
directed into the backward hemisphere.
Further studies of directivity patterns of symphonic brass instruments have
been carried out by Otondo and Rindel (2004, 2005) and also by Pätynen and
Lokki (2010). The approach taken by Pätynen and Lokki, using a dodecahedral
microphone array in an anechoic chamber to record performances by professional
players, is illustrated in Fig. 4.88. Four rings of five microphones encircled the
players, at elevation angles of ±11 ◦ and ±53 ◦ , with two additional microphones
directly in front of and above the musician. From recordings of two-octave arpeggios
played in registers appropriate to the instruments, maps of the directivity as a
function of azimuthal angle and angle of elevation were derived. In the maps shown
for a tuba in Fig. 4.88, a trumpet in Fig. 4.89a and a french horn in Fig. 4.89b, the
frequency responses are averaged over third octave bands and normalised so that the
highest pressure recorded in a given third octave band is recorded as 0 dB (white on
the greyscale).
4 After the Lips: Acoustic Resonances and Radiation
Fig. 4.86 Measured directivity index plots for (a) a trombone; (b) a trumpet. Axial units: degrees.
Radial units: decibels relative to an isotropic radiator with equal acoustic power. Data from Meyer
(2009)
for the trombone becomes negative, indicating that the intensity of radiation is lower
than it would be from a simple source of the same total power.
An alternative method of graphing the beam patterns of radiation from brass
instruments, devised by Meyer (2009), is illustrated in Fig. 4.87a. The shaded area
represents the angular zone within which the sound intensity radiated by a trumpet
does not fall below 3 dB of its maximum value. The view shown is taken from
the player’s right-hand side and shows the increasing concentration of energy in a
narrow cone along the bell axis. An example of a view of the radiation pattern from
a french horn, seen from above the player, is reproduced in Fig. 4.87b. Because
of the way in which the horn is held by the player, the radiation pattern is more
complicated, and it is notable that at high frequencies, the radiation is most strongly
directed into the backward hemisphere.
Further studies of directivity patterns of symphonic brass instruments have
been carried out by Otondo and Rindel (2004, 2005) and also by Pätynen and
Lokki (2010). The approach taken by Pätynen and Lokki, using a dodecahedral
microphone array in an anechoic chamber to record performances by professional
players, is illustrated in Fig. 4.88. Four rings of five microphones encircled the
players, at elevation angles of ±11 ◦ and ±53 ◦ , with two additional microphones
directly in front of and above the musician. From recordings of two-octave arpeggios
played in registers appropriate to the instruments, maps of the directivity as a
function of azimuthal angle and angle of elevation were derived. In the maps shown
for a tuba in Fig. 4.88, a trumpet in Fig. 4.89a and a french horn in Fig. 4.89b, the
frequency responses are averaged over third octave bands and normalised so that the
highest pressure recorded in a given third octave band is recorded as 0 dB (white on
the greyscale).