

72
S. Sood et al.
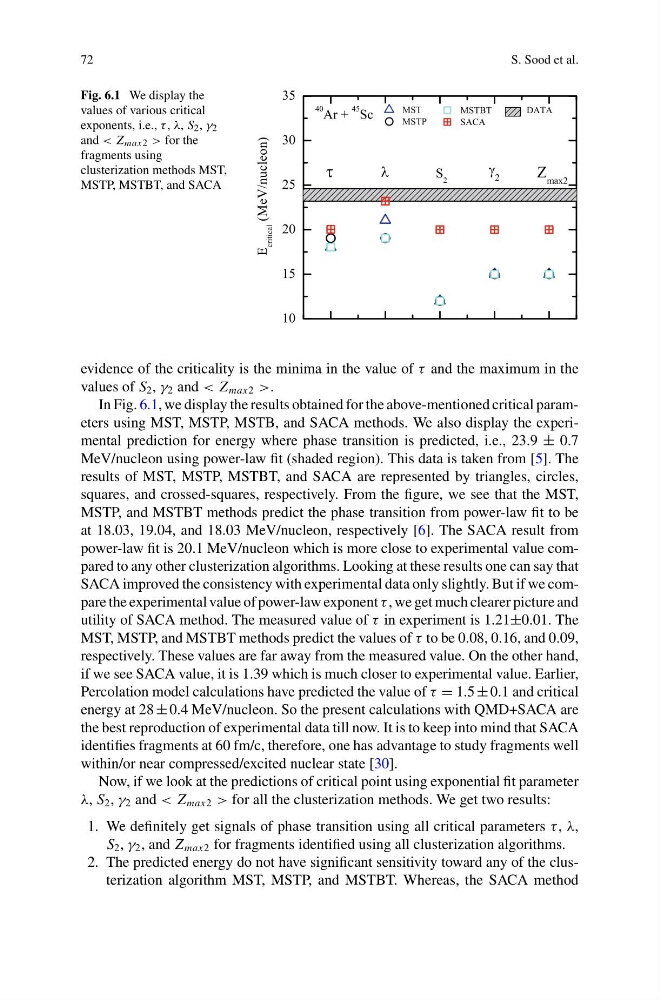
Fig. 6.1 We display the
values of various critical
exponents, i.e., τ , λ, S 2 , γ 2
and < Z max2 > for the
fragments using
clusterization methods MST,
MSTP, MSTBT, and SACA
evidence of the criticality is the minima in the value of τ and the maximum in the
values of S 2 , γ 2 and < Z max2 >.
In Fig. 6.1, we display the results obtained for the above-mentioned critical parameters using MST, MSTP, MSTB, and SACA methods. We also display the experimental prediction for energy where phase transition is predicted, i.e., 23.9 ± 0.7
MeV/nucleon using power-law fit (shaded region). This data is taken from [5]. The
results of MST, MSTP, MSTBT, and SACA are represented by triangles, circles,
squares, and crossed-squares, respectively. From the figure, we see that the MST,
MSTP, and MSTBT methods predict the phase transition from power-law fit to be
at 18.03, 19.04, and 18.03 MeV/nucleon, respectively [6]. The SACA result from
power-law fit is 20.1 MeV/nucleon which is more close to experimental value compared to any other clusterization algorithms. Looking at these results one can say that
SACA improved the consistency with experimental data only slightly. But if we compare the experimental value of power-law exponent τ , we get much clearer picture and
utility of SACA method. The measured value of τ in experiment is 1.21±0.01. The
MST, MSTP, and MSTBT methods predict the values of τ to be 0.08, 0.16, and 0.09,
respectively. These values are far away from the measured value. On the other hand,
if we see SACA value, it is 1.39 which is much closer to experimental value. Earlier,
Percolation model calculations have predicted the value of τ = 1.5 ± 0.1 and critical
energy at 28 ± 0.4 MeV/nucleon. So the present calculations with QMD+SACA are
the best reproduction of experimental data till now. It is to keep into mind that SACA
identifies fragments at 60 fm/c, therefore, one has advantage to study fragments well
within/or near compressed/excited nuclear state [30].
Now, if we look at the predictions of critical point using exponential fit parameter
λ, S 2 , γ 2 and < Z max2 > for all the clusterization methods. We get two results:
1. We definitely get signals of phase transition using all critical parameters τ , λ,
S 2 , γ 2 , and Z max2 for fragments identified using all clusterization algorithms.
2. The predicted energy do not have significant sensitivity toward any of the clusterization algorithm MST, MSTP, and MSTBT. Whereas, the SACA method
S. Sood et al.
Fig. 6.1 We display the
values of various critical
exponents, i.e., τ , λ, S 2 , γ 2
and < Z max2 > for the
fragments using
clusterization methods MST,
MSTP, MSTBT, and SACA
evidence of the criticality is the minima in the value of τ and the maximum in the
values of S 2 , γ 2 and < Z max2 >.
In Fig. 6.1, we display the results obtained for the above-mentioned critical parameters using MST, MSTP, MSTB, and SACA methods. We also display the experimental prediction for energy where phase transition is predicted, i.e., 23.9 ± 0.7
MeV/nucleon using power-law fit (shaded region). This data is taken from [5]. The
results of MST, MSTP, MSTBT, and SACA are represented by triangles, circles,
squares, and crossed-squares, respectively. From the figure, we see that the MST,
MSTP, and MSTBT methods predict the phase transition from power-law fit to be
at 18.03, 19.04, and 18.03 MeV/nucleon, respectively [6]. The SACA result from
power-law fit is 20.1 MeV/nucleon which is more close to experimental value compared to any other clusterization algorithms. Looking at these results one can say that
SACA improved the consistency with experimental data only slightly. But if we compare the experimental value of power-law exponent τ , we get much clearer picture and
utility of SACA method. The measured value of τ in experiment is 1.21±0.01. The
MST, MSTP, and MSTBT methods predict the values of τ to be 0.08, 0.16, and 0.09,
respectively. These values are far away from the measured value. On the other hand,
if we see SACA value, it is 1.39 which is much closer to experimental value. Earlier,
Percolation model calculations have predicted the value of τ = 1.5 ± 0.1 and critical
energy at 28 ± 0.4 MeV/nucleon. So the present calculations with QMD+SACA are
the best reproduction of experimental data till now. It is to keep into mind that SACA
identifies fragments at 60 fm/c, therefore, one has advantage to study fragments well
within/or near compressed/excited nuclear state [30].
Now, if we look at the predictions of critical point using exponential fit parameter
λ, S 2 , γ 2 and < Z max2 > for all the clusterization methods. We get two results:
1. We definitely get signals of phase transition using all critical parameters τ , λ,
S 2 , γ 2 , and Z max2 for fragments identified using all clusterization algorithms.
2. The predicted energy do not have significant sensitivity toward any of the clusterization algorithm MST, MSTP, and MSTBT. Whereas, the SACA method