

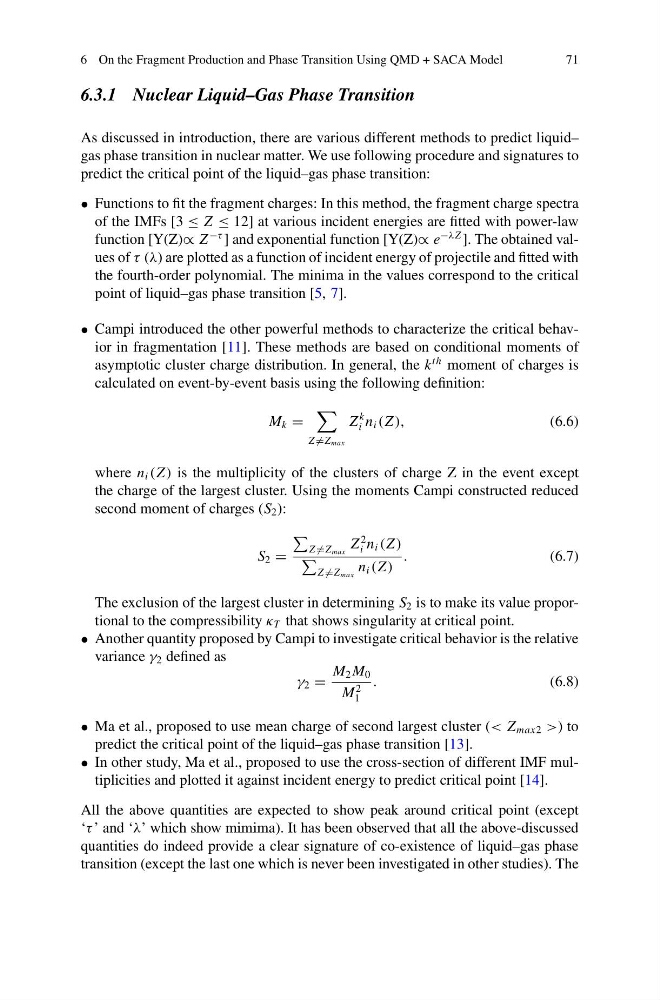
6 On the Fragment Production and Phase Transition Using QMD + SACA Model
71
6.3.1 Nuclear Liquid–Gas Phase Transition
As discussed in introduction, there are various different methods to predict liquid–
gas phase transition in nuclear matter. We use following procedure and signatures to
predict the critical point of the liquid–gas phase transition:
• Functions to fit the fragment charges: In this method, the fragment charge spectra
of the IMFs [3 ≤ Z ≤ 12] at various incident energies are fitted with power-law
function [Y(Z)∝ Z
−τ ] and exponential function [Y(Z)∝ e
−λZ ]. The obtained values of τ (λ) are plotted as a function of incident energy of projectile and fitted with
the fourth-order polynomial. The minima in the values correspond to the critical
point of liquid–gas phase transition [5, 7].
• Campi introduced the other powerful methods to characterize the critical behavior in fragmentation [11]. These methods are based on conditional moments of
asymptotic cluster charge distribution. In general, the k
th moment of charges is
calculated on event-by-event basis using the following definition:
M k =
Z =Z max
Z
k
i n i (Z ),
(6.6)
where n i (Z ) is the multiplicity of the clusters of charge Z in the event except
the charge of the largest cluster. Using the moments Campi constructed reduced
second moment of charges (S 2 ):
S 2 =
Z =Z max
Z
2
i n i (Z )
Z =Z max
n i (Z )
.
(6.7)
The exclusion of the largest cluster in determining S 2 is to make its value proportional to the compressibility κ T that shows singularity at critical point.
• Another quantity proposed by Campi to investigate critical behavior is the relative
variance γ 2 defined as
γ 2 =
M 2 M 0
M
2
1
.
(6.8)
• Ma et al., proposed to use mean charge of second largest cluster (< Z max2 >) to
predict the critical point of the liquid–gas phase transition [13].
• In other study, Ma et al., proposed to use the cross-section of different IMF multiplicities and plotted it against incident energy to predict critical point [14].
All the above quantities are expected to show peak around critical point (except
‘τ ’ and ‘λ’ which show mimima). It has been observed that all the above-discussed
quantities do indeed provide a clear signature of co-existence of liquid–gas phase
transition (except the last one which is never been investigated in other studies). The
71
6.3.1 Nuclear Liquid–Gas Phase Transition
As discussed in introduction, there are various different methods to predict liquid–
gas phase transition in nuclear matter. We use following procedure and signatures to
predict the critical point of the liquid–gas phase transition:
• Functions to fit the fragment charges: In this method, the fragment charge spectra
of the IMFs [3 ≤ Z ≤ 12] at various incident energies are fitted with power-law
function [Y(Z)∝ Z
−τ ] and exponential function [Y(Z)∝ e
−λZ ]. The obtained values of τ (λ) are plotted as a function of incident energy of projectile and fitted with
the fourth-order polynomial. The minima in the values correspond to the critical
point of liquid–gas phase transition [5, 7].
• Campi introduced the other powerful methods to characterize the critical behavior in fragmentation [11]. These methods are based on conditional moments of
asymptotic cluster charge distribution. In general, the k
th moment of charges is
calculated on event-by-event basis using the following definition:
M k =
Z =Z max
Z
k
i n i (Z ),
(6.6)
where n i (Z ) is the multiplicity of the clusters of charge Z in the event except
the charge of the largest cluster. Using the moments Campi constructed reduced
second moment of charges (S 2 ):
S 2 =
Z =Z max
Z
2
i n i (Z )
Z =Z max
n i (Z )
.
(6.7)
The exclusion of the largest cluster in determining S 2 is to make its value proportional to the compressibility κ T that shows singularity at critical point.
• Another quantity proposed by Campi to investigate critical behavior is the relative
variance γ 2 defined as
γ 2 =
M 2 M 0
M
2
1
.
(6.8)
• Ma et al., proposed to use mean charge of second largest cluster (< Z max2 >) to
predict the critical point of the liquid–gas phase transition [13].
• In other study, Ma et al., proposed to use the cross-section of different IMF multiplicities and plotted it against incident energy to predict critical point [14].
All the above quantities are expected to show peak around critical point (except
‘τ ’ and ‘λ’ which show mimima). It has been observed that all the above-discussed
quantities do indeed provide a clear signature of co-existence of liquid–gas phase
transition (except the last one which is never been investigated in other studies). The