

6 On the Fragment Production and Phase Transition Using QMD + SACA Model
73
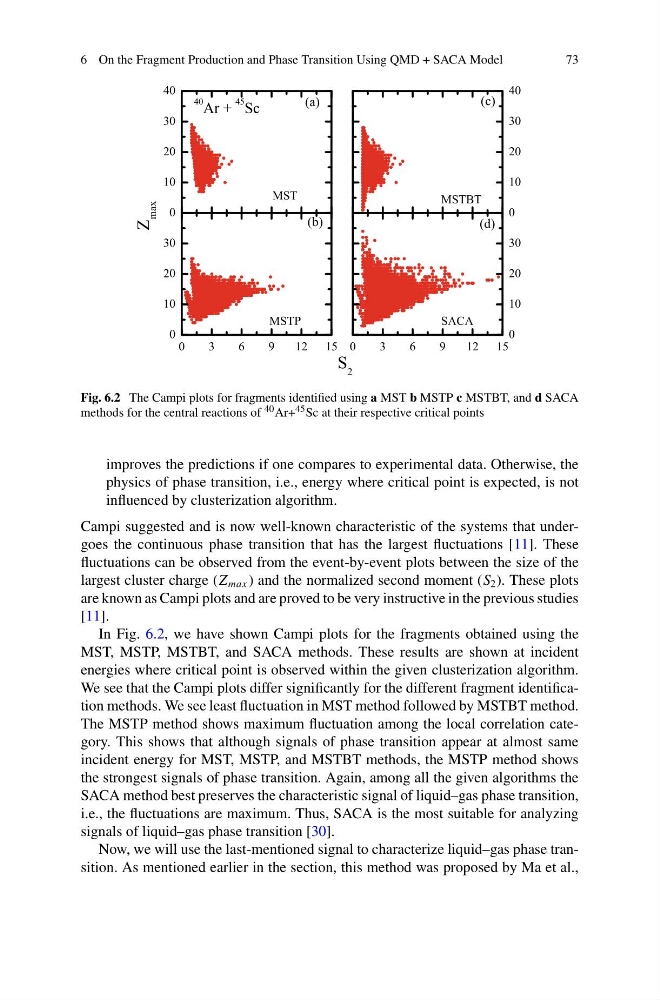
Fig. 6.2 The Campi plots for fragments identified using a MST b MSTP c MSTBT, and d SACA
methods for the central reactions of 40 Ar+ 45 Sc at their respective critical points
improves the predictions if one compares to experimental data. Otherwise, the
physics of phase transition, i.e., energy where critical point is expected, is not
influenced by clusterization algorithm.
Campi suggested and is now well-known characteristic of the systems that undergoes the continuous phase transition that has the largest fluctuations [11]. These
fluctuations can be observed from the event-by-event plots between the size of the
largest cluster charge (Z max ) and the normalized second moment (S 2 ). These plots
are known as Campi plots and are proved to be very instructive in the previous studies
[11].
In Fig. 6.2, we have shown Campi plots for the fragments obtained using the
MST, MSTP, MSTBT, and SACA methods. These results are shown at incident
energies where critical point is observed within the given clusterization algorithm.
We see that the Campi plots differ significantly for the different fragment identification methods. We see least fluctuation in MST method followed by MSTBT method.
The MSTP method shows maximum fluctuation among the local correlation category. This shows that although signals of phase transition appear at almost same
incident energy for MST, MSTP, and MSTBT methods, the MSTP method shows
the strongest signals of phase transition. Again, among all the given algorithms the
SACA method best preserves the characteristic signal of liquid–gas phase transition,
i.e., the fluctuations are maximum. Thus, SACA is the most suitable for analyzing
signals of liquid–gas phase transition [30].
Now, we will use the last-mentioned signal to characterize liquid–gas phase transition. As mentioned earlier in the section, this method was proposed by Ma et al.,
73
Fig. 6.2 The Campi plots for fragments identified using a MST b MSTP c MSTBT, and d SACA
methods for the central reactions of 40 Ar+ 45 Sc at their respective critical points
improves the predictions if one compares to experimental data. Otherwise, the
physics of phase transition, i.e., energy where critical point is expected, is not
influenced by clusterization algorithm.
Campi suggested and is now well-known characteristic of the systems that undergoes the continuous phase transition that has the largest fluctuations [11]. These
fluctuations can be observed from the event-by-event plots between the size of the
largest cluster charge (Z max ) and the normalized second moment (S 2 ). These plots
are known as Campi plots and are proved to be very instructive in the previous studies
[11].
In Fig. 6.2, we have shown Campi plots for the fragments obtained using the
MST, MSTP, MSTBT, and SACA methods. These results are shown at incident
energies where critical point is observed within the given clusterization algorithm.
We see that the Campi plots differ significantly for the different fragment identification methods. We see least fluctuation in MST method followed by MSTBT method.
The MSTP method shows maximum fluctuation among the local correlation category. This shows that although signals of phase transition appear at almost same
incident energy for MST, MSTP, and MSTBT methods, the MSTP method shows
the strongest signals of phase transition. Again, among all the given algorithms the
SACA method best preserves the characteristic signal of liquid–gas phase transition,
i.e., the fluctuations are maximum. Thus, SACA is the most suitable for analyzing
signals of liquid–gas phase transition [30].
Now, we will use the last-mentioned signal to characterize liquid–gas phase transition. As mentioned earlier in the section, this method was proposed by Ma et al.,