

2 New Signatures of Phase Transition from Models of Nuclear Multifragmentation
21
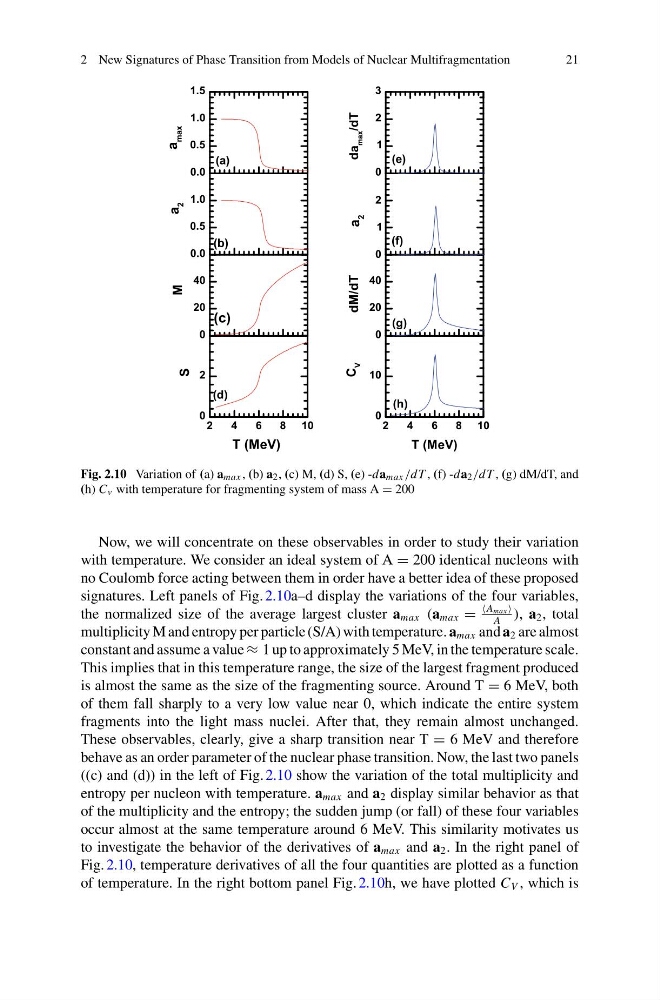
Fig. 2.10 Variation of (a) a max , (b) a 2 , (c) M, (d) S, (e) -da max /dT , (f) -da 2 /dT , (g) dM/dT, and
(h) C v with temperature for fragmenting system of mass A = 200
Now, we will concentrate on these observables in order to study their variation
with temperature. We consider an ideal system of A = 200 identical nucleons with
no Coulomb force acting between them in order have a better idea of these proposed
signatures. Left panels of Fig. 2.10a–d display the variations of the four variables,
the normalized size of the average largest cluster a max (a max =
max
A
), a 2 , total
multiplicity M and entropy per particle (S/A) with temperature. a max and a 2 are almost
constant and assume a value ≈ 1 up to approximately 5 MeV, in the temperature scale.
This implies that in this temperature range, the size of the largest fragment produced
is almost the same as the size of the fragmenting source. Around T = 6 MeV, both
of them fall sharply to a very low value near 0, which indicate the entire system
fragments into the light mass nuclei. After that, they remain almost unchanged.
These observables, clearly, give a sharp transition near T = 6 MeV and therefore
behave as an order parameter of the nuclear phase transition. Now, the last two panels
((c) and (d)) in the left of Fig. 2.10 show the variation of the total multiplicity and
entropy per nucleon with temperature. a max and a 2 display similar behavior as that
of the multiplicity and the entropy; the sudden jump (or fall) of these four variables
occur almost at the same temperature around 6 MeV. This similarity motivates us
to investigate the behavior of the derivatives of a max and a 2 . In the right panel of
Fig. 2.10, temperature derivatives of all the four quantities are plotted as a function
of temperature. In the right bottom panel Fig. 2.10h, we have plotted C V , which is
21
Fig. 2.10 Variation of (a) a max , (b) a 2 , (c) M, (d) S, (e) -da max /dT , (f) -da 2 /dT , (g) dM/dT, and
(h) C v with temperature for fragmenting system of mass A = 200
Now, we will concentrate on these observables in order to study their variation
with temperature. We consider an ideal system of A = 200 identical nucleons with
no Coulomb force acting between them in order have a better idea of these proposed
signatures. Left panels of Fig. 2.10a–d display the variations of the four variables,
the normalized size of the average largest cluster a max (a max =
max
A
), a 2 , total
multiplicity M and entropy per particle (S/A) with temperature. a max and a 2 are almost
constant and assume a value ≈ 1 up to approximately 5 MeV, in the temperature scale.
This implies that in this temperature range, the size of the largest fragment produced
is almost the same as the size of the fragmenting source. Around T = 6 MeV, both
of them fall sharply to a very low value near 0, which indicate the entire system
fragments into the light mass nuclei. After that, they remain almost unchanged.
These observables, clearly, give a sharp transition near T = 6 MeV and therefore
behave as an order parameter of the nuclear phase transition. Now, the last two panels
((c) and (d)) in the left of Fig. 2.10 show the variation of the total multiplicity and
entropy per nucleon with temperature. a max and a 2 display similar behavior as that
of the multiplicity and the entropy; the sudden jump (or fall) of these four variables
occur almost at the same temperature around 6 MeV. This similarity motivates us
to investigate the behavior of the derivatives of a max and a 2 . In the right panel of
Fig. 2.10, temperature derivatives of all the four quantities are plotted as a function
of temperature. In the right bottom panel Fig. 2.10h, we have plotted C V , which is