

22
G. Chaudhuri et al.
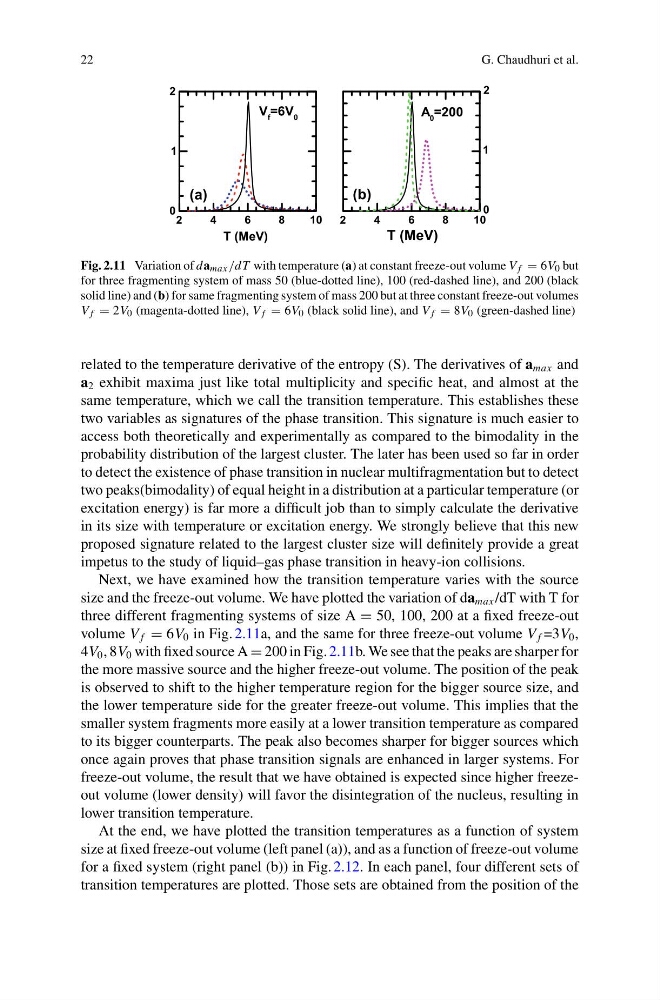
Fig. 2.11 Variation of da max /dT with temperature (a) at constant freeze-out volume V f = 6V 0 but
for three fragmenting system of mass 50 (blue-dotted line), 100 (red-dashed line), and 200 (black
solid line) and (b) for same fragmenting system of mass 200 but at three constant freeze-out volumes
V f = 2V 0 (magenta-dotted line), V f = 6V 0 (black solid line), and V f = 8V 0 (green-dashed line)
related to the temperature derivative of the entropy (S). The derivatives of a max and
a 2 exhibit maxima just like total multiplicity and specific heat, and almost at the
same temperature, which we call the transition temperature. This establishes these
two variables as signatures of the phase transition. This signature is much easier to
access both theoretically and experimentally as compared to the bimodality in the
probability distribution of the largest cluster. The later has been used so far in order
to detect the existence of phase transition in nuclear multifragmentation but to detect
two peaks(bimodality) of equal height in a distribution at a particular temperature (or
excitation energy) is far more a difficult job than to simply calculate the derivative
in its size with temperature or excitation energy. We strongly believe that this new
proposed signature related to the largest cluster size will definitely provide a great
impetus to the study of liquid–gas phase transition in heavy-ion collisions.
Next, we have examined how the transition temperature varies with the source
size and the freeze-out volume. We have plotted the variation of da max /dT with T for
three different fragmenting systems of size A = 50, 100, 200 at a fixed freeze-out
volume V f = 6V 0 in Fig. 2.11a, and the same for three freeze-out volume V f =3V 0 ,
4V 0 , 8V 0 with fixed source A = 200 in Fig. 2.11b. We see that the peaks are sharper for
the more massive source and the higher freeze-out volume. The position of the peak
is observed to shift to the higher temperature region for the bigger source size, and
the lower temperature side for the greater freeze-out volume. This implies that the
smaller system fragments more easily at a lower transition temperature as compared
to its bigger counterparts. The peak also becomes sharper for bigger sources which
once again proves that phase transition signals are enhanced in larger systems. For
freeze-out volume, the result that we have obtained is expected since higher freezeout volume (lower density) will favor the disintegration of the nucleus, resulting in
lower transition temperature.
At the end, we have plotted the transition temperatures as a function of system
size at fixed freeze-out volume (left panel (a)), and as a function of freeze-out volume
for a fixed system (right panel (b)) in Fig. 2.12. In each panel, four different sets of
transition temperatures are plotted. Those sets are obtained from the position of the
G. Chaudhuri et al.
Fig. 2.11 Variation of da max /dT with temperature (a) at constant freeze-out volume V f = 6V 0 but
for three fragmenting system of mass 50 (blue-dotted line), 100 (red-dashed line), and 200 (black
solid line) and (b) for same fragmenting system of mass 200 but at three constant freeze-out volumes
V f = 2V 0 (magenta-dotted line), V f = 6V 0 (black solid line), and V f = 8V 0 (green-dashed line)
related to the temperature derivative of the entropy (S). The derivatives of a max and
a 2 exhibit maxima just like total multiplicity and specific heat, and almost at the
same temperature, which we call the transition temperature. This establishes these
two variables as signatures of the phase transition. This signature is much easier to
access both theoretically and experimentally as compared to the bimodality in the
probability distribution of the largest cluster. The later has been used so far in order
to detect the existence of phase transition in nuclear multifragmentation but to detect
two peaks(bimodality) of equal height in a distribution at a particular temperature (or
excitation energy) is far more a difficult job than to simply calculate the derivative
in its size with temperature or excitation energy. We strongly believe that this new
proposed signature related to the largest cluster size will definitely provide a great
impetus to the study of liquid–gas phase transition in heavy-ion collisions.
Next, we have examined how the transition temperature varies with the source
size and the freeze-out volume. We have plotted the variation of da max /dT with T for
three different fragmenting systems of size A = 50, 100, 200 at a fixed freeze-out
volume V f = 6V 0 in Fig. 2.11a, and the same for three freeze-out volume V f =3V 0 ,
4V 0 , 8V 0 with fixed source A = 200 in Fig. 2.11b. We see that the peaks are sharper for
the more massive source and the higher freeze-out volume. The position of the peak
is observed to shift to the higher temperature region for the bigger source size, and
the lower temperature side for the greater freeze-out volume. This implies that the
smaller system fragments more easily at a lower transition temperature as compared
to its bigger counterparts. The peak also becomes sharper for bigger sources which
once again proves that phase transition signals are enhanced in larger systems. For
freeze-out volume, the result that we have obtained is expected since higher freezeout volume (lower density) will favor the disintegration of the nucleus, resulting in
lower transition temperature.
At the end, we have plotted the transition temperatures as a function of system
size at fixed freeze-out volume (left panel (a)), and as a function of freeze-out volume
for a fixed system (right panel (b)) in Fig. 2.12. In each panel, four different sets of
transition temperatures are plotted. Those sets are obtained from the position of the