

20
G. Chaudhuri et al.
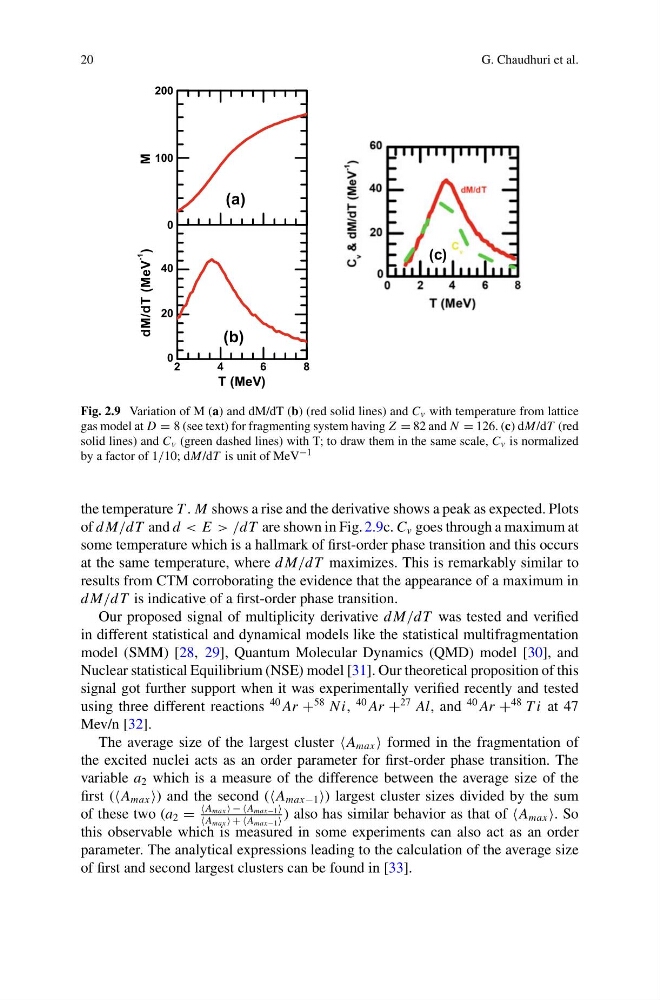
Fig. 2.9 Variation of M (a) and dM/dT (b) (red solid lines) and C v with temperature from lattice
gas model at D = 8 (see text) for fragmenting system having Z = 82 and N = 126. (c) dM/dT (red
solid lines) and C v (green dashed lines) with T; to draw them in the same scale, C v is normalized
by a factor of 1/10; dM/dT is unit of MeV −1
the temperature T . M shows a rise and the derivative shows a peak as expected. Plots
of d M/dT and d < E > /dT are shown in Fig. 2.9c. C v goes through a maximum at
some temperature which is a hallmark of first-order phase transition and this occurs
at the same temperature, where d M/dT maximizes. This is remarkably similar to
results from CTM corroborating the evidence that the appearance of a maximum in
d M/dT is indicative of a first-order phase transition.
Our proposed signal of multiplicity derivative d M/dT was tested and verified
in different statistical and dynamical models like the statistical multifragmentation
model (SMM) [28, 29], Quantum Molecular Dynamics (QMD) model [30], and
Nuclear statistical Equilibrium (NSE) model [31]. Our theoretical proposition of this
signal got further support when it was experimentally verified recently and tested
using three different reactions
40 Ar +
58 Ni,
40 Ar +
27 Al, and
40 Ar +
48 T i at 47
Mev/n [32].
The average size of the largest cluster max formed in the fragmentation of
the excited nuclei acts as an order parameter for first-order phase transition. The
variable a 2 which is a measure of the difference between the average size of the
first ( max ) and the second ( max−1 ) largest cluster sizes divided by the sum
of these two (a 2 =
A max − −A max−1
max + +A max−1
) also has similar behavior as that of max . So
this observable which is measured in some experiments can also act as an order
parameter. The analytical expressions leading to the calculation of the average size
of first and second largest clusters can be found in [33].
G. Chaudhuri et al.
Fig. 2.9 Variation of M (a) and dM/dT (b) (red solid lines) and C v with temperature from lattice
gas model at D = 8 (see text) for fragmenting system having Z = 82 and N = 126. (c) dM/dT (red
solid lines) and C v (green dashed lines) with T; to draw them in the same scale, C v is normalized
by a factor of 1/10; dM/dT is unit of MeV −1
the temperature T . M shows a rise and the derivative shows a peak as expected. Plots
of d M/dT and d < E > /dT are shown in Fig. 2.9c. C v goes through a maximum at
some temperature which is a hallmark of first-order phase transition and this occurs
at the same temperature, where d M/dT maximizes. This is remarkably similar to
results from CTM corroborating the evidence that the appearance of a maximum in
d M/dT is indicative of a first-order phase transition.
Our proposed signal of multiplicity derivative d M/dT was tested and verified
in different statistical and dynamical models like the statistical multifragmentation
model (SMM) [28, 29], Quantum Molecular Dynamics (QMD) model [30], and
Nuclear statistical Equilibrium (NSE) model [31]. Our theoretical proposition of this
signal got further support when it was experimentally verified recently and tested
using three different reactions
40 Ar +
58 Ni,
40 Ar +
27 Al, and
40 Ar +
48 T i at 47
Mev/n [32].
The average size of the largest cluster max formed in the fragmentation of
the excited nuclei acts as an order parameter for first-order phase transition. The
variable a 2 which is a measure of the difference between the average size of the
first ( max ) and the second ( max−1 ) largest cluster sizes divided by the sum
of these two (a 2 =
A max − −A max−1
max + +A max−1
) also has similar behavior as that of max . So
this observable which is measured in some experiments can also act as an order
parameter. The analytical expressions leading to the calculation of the average size
of first and second largest clusters can be found in [33].