

2 New Signatures of Phase Transition from Models of Nuclear Multifragmentation
19
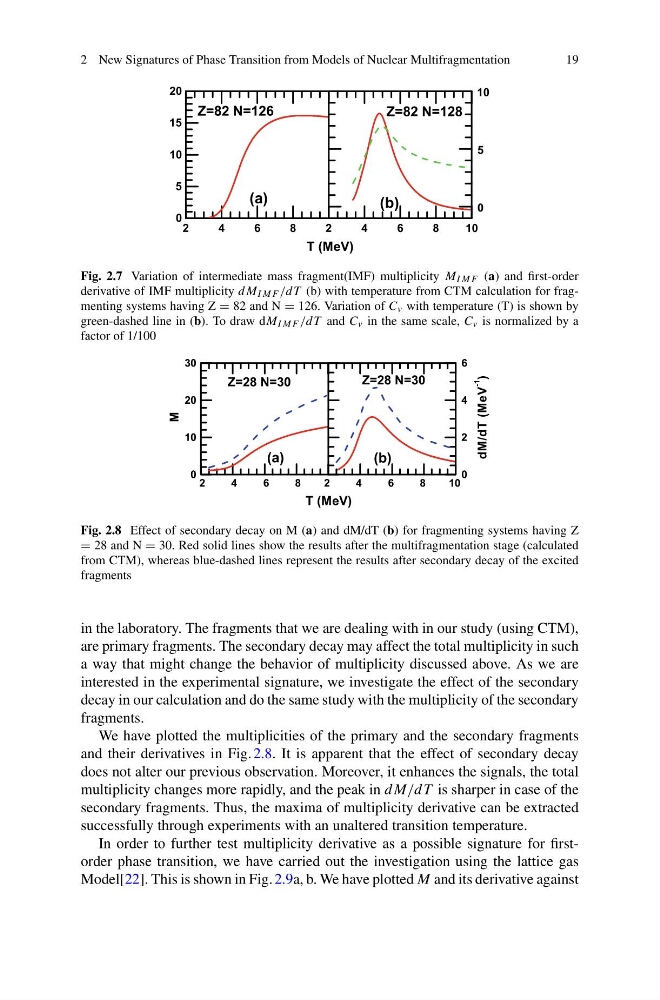
Fig. 2.7 Variation of intermediate mass fragment(IMF) multiplicity M I M F (a) and first-order
derivative of IMF multiplicity d M I M F /dT (b) with temperature from CTM calculation for fragmenting systems having Z = 82 and N = 126. Variation of C v with temperature (T) is shown by
green-dashed line in (b). To draw dM I M F /dT and C v in the same scale, C v is normalized by a
factor of 1/100
Fig. 2.8 Effect of secondary decay on M (a) and dM/dT (b) for fragmenting systems having Z
= 28 and N = 30. Red solid lines show the results after the multifragmentation stage (calculated
from CTM), whereas blue-dashed lines represent the results after secondary decay of the excited
fragments
in the laboratory. The fragments that we are dealing with in our study (using CTM),
are primary fragments. The secondary decay may affect the total multiplicity in such
a way that might change the behavior of multiplicity discussed above. As we are
interested in the experimental signature, we investigate the effect of the secondary
decay in our calculation and do the same study with the multiplicity of the secondary
fragments.
We have plotted the multiplicities of the primary and the secondary fragments
and their derivatives in Fig. 2.8. It is apparent that the effect of secondary decay
does not alter our previous observation. Moreover, it enhances the signals, the total
multiplicity changes more rapidly, and the peak in d M/dT is sharper in case of the
secondary fragments. Thus, the maxima of multiplicity derivative can be extracted
successfully through experiments with an unaltered transition temperature.
In order to further test multiplicity derivative as a possible signature for firstorder phase transition, we have carried out the investigation using the lattice gas
Model[22]. This is shown in Fig. 2.9a, b. We have plotted M and its derivative against
19
Fig. 2.7 Variation of intermediate mass fragment(IMF) multiplicity M I M F (a) and first-order
derivative of IMF multiplicity d M I M F /dT (b) with temperature from CTM calculation for fragmenting systems having Z = 82 and N = 126. Variation of C v with temperature (T) is shown by
green-dashed line in (b). To draw dM I M F /dT and C v in the same scale, C v is normalized by a
factor of 1/100
Fig. 2.8 Effect of secondary decay on M (a) and dM/dT (b) for fragmenting systems having Z
= 28 and N = 30. Red solid lines show the results after the multifragmentation stage (calculated
from CTM), whereas blue-dashed lines represent the results after secondary decay of the excited
fragments
in the laboratory. The fragments that we are dealing with in our study (using CTM),
are primary fragments. The secondary decay may affect the total multiplicity in such
a way that might change the behavior of multiplicity discussed above. As we are
interested in the experimental signature, we investigate the effect of the secondary
decay in our calculation and do the same study with the multiplicity of the secondary
fragments.
We have plotted the multiplicities of the primary and the secondary fragments
and their derivatives in Fig. 2.8. It is apparent that the effect of secondary decay
does not alter our previous observation. Moreover, it enhances the signals, the total
multiplicity changes more rapidly, and the peak in d M/dT is sharper in case of the
secondary fragments. Thus, the maxima of multiplicity derivative can be extracted
successfully through experiments with an unaltered transition temperature.
In order to further test multiplicity derivative as a possible signature for firstorder phase transition, we have carried out the investigation using the lattice gas
Model[22]. This is shown in Fig. 2.9a, b. We have plotted M and its derivative against