

13 Elliptic Flow in Relativistic Heavy-Ion Collisions
181
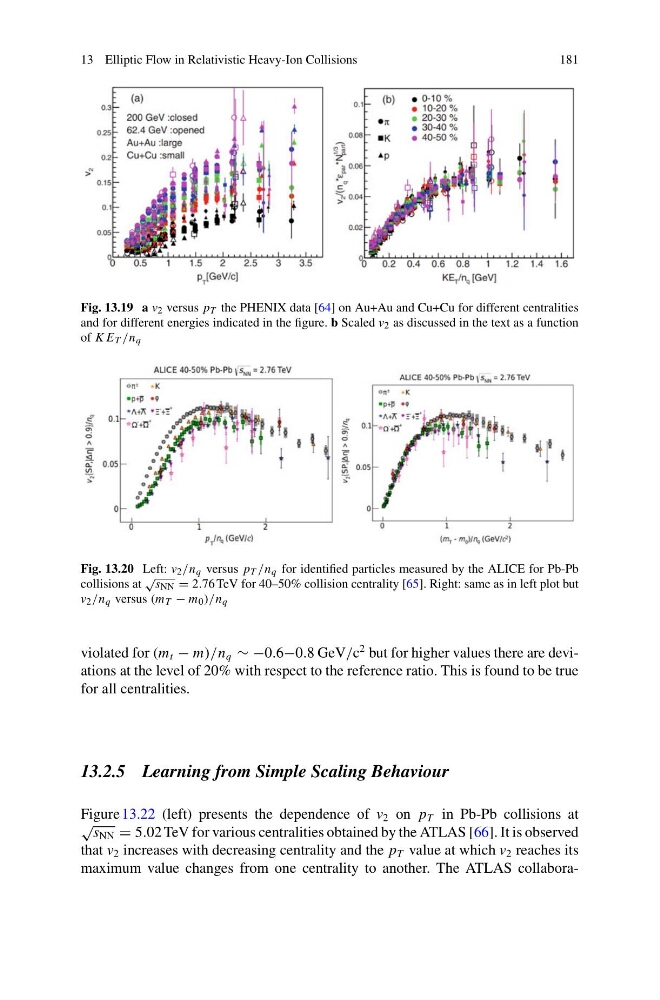
Fig. 13.19 a v 2 versus p T the PHENIX data [64] on Au+Au and Cu+Cu for different centralities
and for different energies indicated in the figure. b Scaled v 2 as discussed in the text as a function
of K E T /n q
Fig. 13.20 Left: v 2 /n q versus p T /n q for identified particles measured by the ALICE for Pb-Pb
collisions at
√
s NN = 2.76 TeV for 40–50% collision centrality [65]. Right: same as in left plot but
v 2 /n q versus (m T − m 0 )/n q
violated for (m t − m)/n q ∼ −0.6−0.8 GeV/c
2 but for higher values there are deviations at the level of 20% with respect to the reference ratio. This is found to be true
for all centralities.
13.2.5 Learning from Simple Scaling Behaviour
Figure 13.22 (left) presents the dependence of v 2 on p T in Pb-Pb collisions at
√
s NN = 5.02 TeV for various centralities obtained by the ATLAS [66]. It is observed
that v 2 increases with decreasing centrality and the p T value at which v 2 reaches its
maximum value changes from one centrality to another. The ATLAS collabora-
181
Fig. 13.19 a v 2 versus p T the PHENIX data [64] on Au+Au and Cu+Cu for different centralities
and for different energies indicated in the figure. b Scaled v 2 as discussed in the text as a function
of K E T /n q
Fig. 13.20 Left: v 2 /n q versus p T /n q for identified particles measured by the ALICE for Pb-Pb
collisions at
√
s NN = 2.76 TeV for 40–50% collision centrality [65]. Right: same as in left plot but
v 2 /n q versus (m T − m 0 )/n q
violated for (m t − m)/n q ∼ −0.6−0.8 GeV/c
2 but for higher values there are deviations at the level of 20% with respect to the reference ratio. This is found to be true
for all centralities.
13.2.5 Learning from Simple Scaling Behaviour
Figure 13.22 (left) presents the dependence of v 2 on p T in Pb-Pb collisions at
√
s NN = 5.02 TeV for various centralities obtained by the ATLAS [66]. It is observed
that v 2 increases with decreasing centrality and the p T value at which v 2 reaches its
maximum value changes from one centrality to another. The ATLAS collabora-