

182
M. M. Aggarwal
Fig. 13.21 Double ratio (v 2 /n q )/(v 2 /n q ) Fit p versus (m T − m 0 )/n q
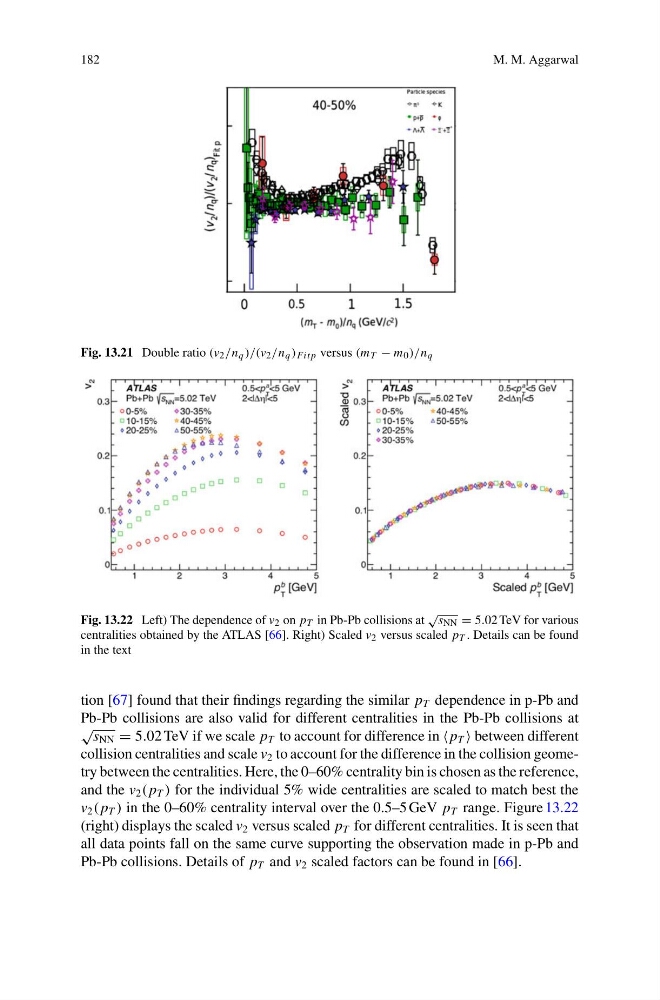
Fig. 13.22 Left) The dependence of v 2 on p T in Pb-Pb collisions at
√ s NN = 5.02 TeV for various
centralities obtained by the ATLAS [66]. Right) Scaled v 2 versus scaled p T . Details can be found
in the text
tion [67] found that their findings regarding the similar p T dependence in p-Pb and
Pb-Pb collisions are also valid for different centralities in the Pb-Pb collisions at
√
s NN = 5.02 TeV if we scale p T to account for difference in p T between different
collision centralities and scale v 2 to account for the difference in the collision geometry between the centralities. Here, the 0–60% centrality bin is chosen as the reference,
and the v 2 ( p T ) for the individual 5% wide centralities are scaled to match best the
v 2 ( p T ) in the 0–60% centrality interval over the 0.5–5 GeV p T range. Figure 13.22
(right) displays the scaled v 2 versus scaled p T for different centralities. It is seen that
all data points fall on the same curve supporting the observation made in p-Pb and
Pb-Pb collisions. Details of p T and v 2 scaled factors can be found in [66].
M. M. Aggarwal
Fig. 13.21 Double ratio (v 2 /n q )/(v 2 /n q ) Fit p versus (m T − m 0 )/n q
Fig. 13.22 Left) The dependence of v 2 on p T in Pb-Pb collisions at
√ s NN = 5.02 TeV for various
centralities obtained by the ATLAS [66]. Right) Scaled v 2 versus scaled p T . Details can be found
in the text
tion [67] found that their findings regarding the similar p T dependence in p-Pb and
Pb-Pb collisions are also valid for different centralities in the Pb-Pb collisions at
√
s NN = 5.02 TeV if we scale p T to account for difference in p T between different
collision centralities and scale v 2 to account for the difference in the collision geometry between the centralities. Here, the 0–60% centrality bin is chosen as the reference,
and the v 2 ( p T ) for the individual 5% wide centralities are scaled to match best the
v 2 ( p T ) in the 0–60% centrality interval over the 0.5–5 GeV p T range. Figure 13.22
(right) displays the scaled v 2 versus scaled p T for different centralities. It is seen that
all data points fall on the same curve supporting the observation made in p-Pb and
Pb-Pb collisions. Details of p T and v 2 scaled factors can be found in [66].