

180
M. M. Aggarwal
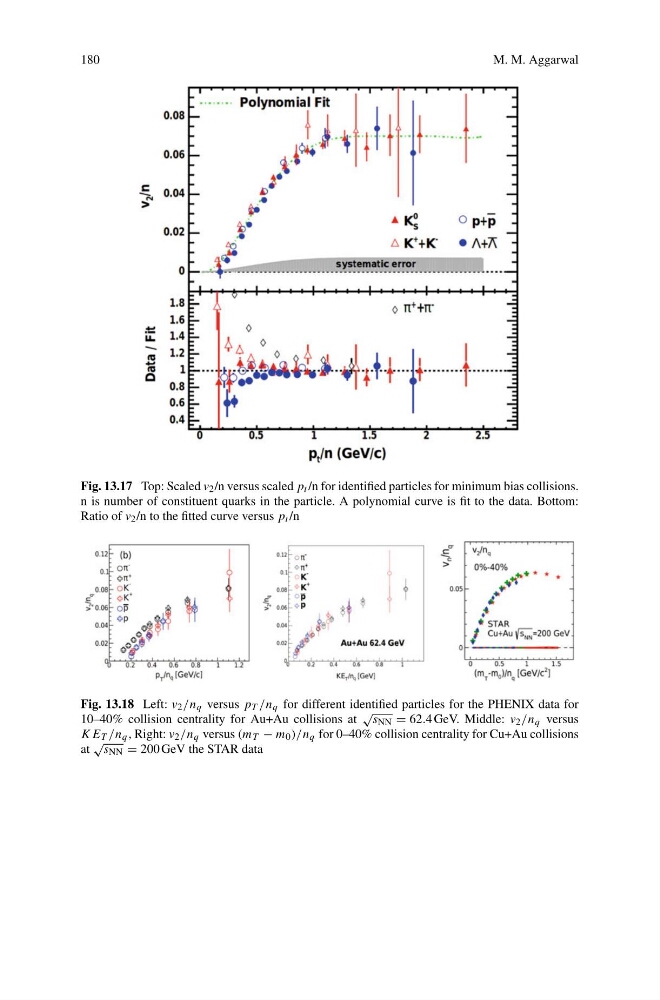
Fig. 13.17 Top: Scaled v 2 /n versus scaled p t /n for identified particles for minimum bias collisions.
n is number of constituent quarks in the particle. A polynomial curve is fit to the data. Bottom:
Ratio of v 2 /n to the fitted curve versus p t /n
Fig. 13.18 Left: v 2 /n q versus p T /n q for different identified particles for the PHENIX data for
10–40% collision centrality for Au+Au collisions at
√
s NN = 62.4 GeV. Middle: v 2 /n q versus
K E T /n q , Right: v 2 /n q versus (m T − m 0 )/n q for 0–40% collision centrality for Cu+Au collisions
at
√
s NN = 200 GeV the STAR data
M. M. Aggarwal
Fig. 13.17 Top: Scaled v 2 /n versus scaled p t /n for identified particles for minimum bias collisions.
n is number of constituent quarks in the particle. A polynomial curve is fit to the data. Bottom:
Ratio of v 2 /n to the fitted curve versus p t /n
Fig. 13.18 Left: v 2 /n q versus p T /n q for different identified particles for the PHENIX data for
10–40% collision centrality for Au+Au collisions at
√
s NN = 62.4 GeV. Middle: v 2 /n q versus
K E T /n q , Right: v 2 /n q versus (m T − m 0 )/n q for 0–40% collision centrality for Cu+Au collisions
at
√
s NN = 200 GeV the STAR data