

13 Elliptic Flow in Relativistic Heavy-Ion Collisions
179
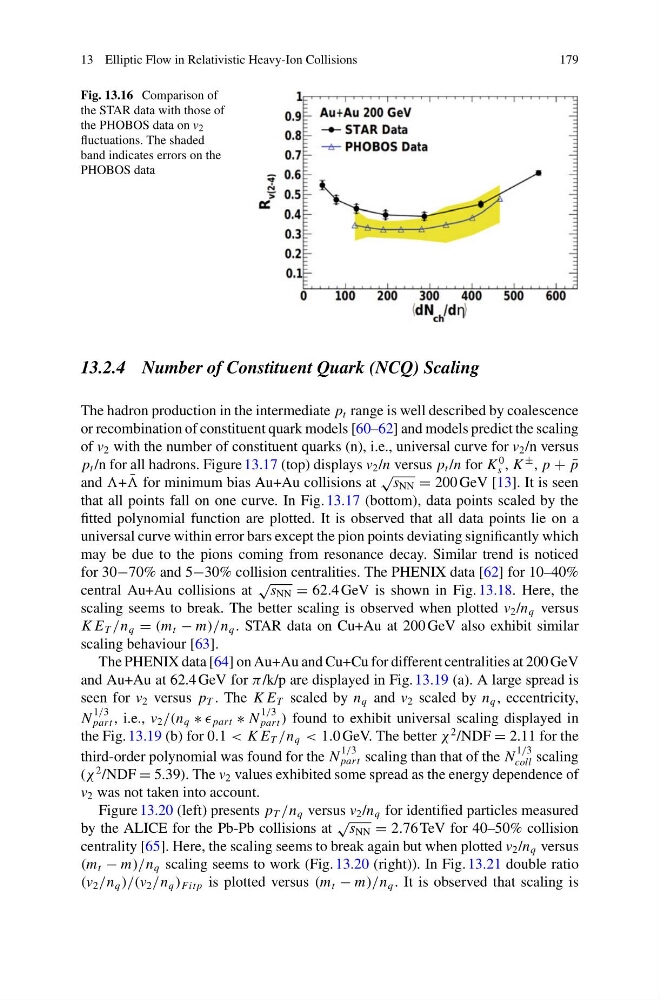
Fig. 13.16 Comparison of
the STAR data with those of
the PHOBOS data on v 2
fluctuations. The shaded
band indicates errors on the
PHOBOS data
13.2.4 Number of Constituent Quark (NCQ) Scaling
The hadron production in the intermediate p t range is well described by coalescence
or recombination of constituent quark models [60–62] and models predict the scaling
of v 2 with the number of constituent quarks (n), i.e., universal curve for v 2 /n versus
p t /n for all hadrons. Figure 13.17 (top) displays v 2 /n versus p t /n for K
0
s , K
± , p + ¯
p
and + ¯
for minimum bias Au+Au collisions at
√
s NN = 200 GeV [13]. It is seen
that all points fall on one curve. In Fig. 13.17 (bottom), data points scaled by the
fitted polynomial function are plotted. It is observed that all data points lie on a
universal curve within error bars except the pion points deviating significantly which
may be due to the pions coming from resonance decay. Similar trend is noticed
for 30−70% and 5−30% collision centralities. The PHENIX data [62] for 10–40%
central Au+Au collisions at
√ s NN = 62.4 GeV is shown in Fig. 13.18. Here, the
scaling seems to break. The better scaling is observed when plotted v 2 /n q versus
K E T /n q = (m t − m)/n q . STAR data on Cu+Au at 200 GeV also exhibit similar
scaling behaviour [63].
The PHENIX data [64] on Au+Au and Cu+Cu for different centralities at 200 GeV
and Au+Au at 62.4 GeV for π /k/p are displayed in Fig. 13.19 (a). A large spread is
seen for v 2 versus p T . The K E T scaled by n q and v 2 scaled by n q , eccentricity,
N
1/3
part , i.e., v 2 /(n q ∗ part ∗ N
1/3
part ) found to exhibit universal scaling displayed in
the Fig. 13.19 (b) for 0.1 < K E T /n q < 1.0 GeV. The better χ
2 /NDF = 2.11 for the
third-order polynomial was found for the N
1/3
part scaling than that of the N
1/3
coll scaling
(χ
2 /NDF = 5.39). The v 2 values exhibited some spread as the energy dependence of
v 2 was not taken into account.
Figure 13.20 (left) presents p T /n q versus v 2 /n q for identified particles measured
by the ALICE for the Pb-Pb collisions at
√ s NN = 2.76 TeV for 40–50% collision
centrality [65]. Here, the scaling seems to break again but when plotted v 2 /n q versus
(m t − m)/n q scaling seems to work (Fig. 13.20 (right)). In Fig. 13.21 double ratio
(v 2 /n q )/(v 2 /n q ) Fit p is plotted versus (m t − m)/n q . It is observed that scaling is
179
Fig. 13.16 Comparison of
the STAR data with those of
the PHOBOS data on v 2
fluctuations. The shaded
band indicates errors on the
PHOBOS data
13.2.4 Number of Constituent Quark (NCQ) Scaling
The hadron production in the intermediate p t range is well described by coalescence
or recombination of constituent quark models [60–62] and models predict the scaling
of v 2 with the number of constituent quarks (n), i.e., universal curve for v 2 /n versus
p t /n for all hadrons. Figure 13.17 (top) displays v 2 /n versus p t /n for K
0
s , K
± , p + ¯
p
and + ¯
for minimum bias Au+Au collisions at
√
s NN = 200 GeV [13]. It is seen
that all points fall on one curve. In Fig. 13.17 (bottom), data points scaled by the
fitted polynomial function are plotted. It is observed that all data points lie on a
universal curve within error bars except the pion points deviating significantly which
may be due to the pions coming from resonance decay. Similar trend is noticed
for 30−70% and 5−30% collision centralities. The PHENIX data [62] for 10–40%
central Au+Au collisions at
√ s NN = 62.4 GeV is shown in Fig. 13.18. Here, the
scaling seems to break. The better scaling is observed when plotted v 2 /n q versus
K E T /n q = (m t − m)/n q . STAR data on Cu+Au at 200 GeV also exhibit similar
scaling behaviour [63].
The PHENIX data [64] on Au+Au and Cu+Cu for different centralities at 200 GeV
and Au+Au at 62.4 GeV for π /k/p are displayed in Fig. 13.19 (a). A large spread is
seen for v 2 versus p T . The K E T scaled by n q and v 2 scaled by n q , eccentricity,
N
1/3
part , i.e., v 2 /(n q ∗ part ∗ N
1/3
part ) found to exhibit universal scaling displayed in
the Fig. 13.19 (b) for 0.1 < K E T /n q < 1.0 GeV. The better χ
2 /NDF = 2.11 for the
third-order polynomial was found for the N
1/3
part scaling than that of the N
1/3
coll scaling
(χ
2 /NDF = 5.39). The v 2 values exhibited some spread as the energy dependence of
v 2 was not taken into account.
Figure 13.20 (left) presents p T /n q versus v 2 /n q for identified particles measured
by the ALICE for the Pb-Pb collisions at
√ s NN = 2.76 TeV for 40–50% collision
centrality [65]. Here, the scaling seems to break again but when plotted v 2 /n q versus
(m t − m)/n q scaling seems to work (Fig. 13.20 (right)). In Fig. 13.21 double ratio
(v 2 /n q )/(v 2 /n q ) Fit p is plotted versus (m t − m)/n q . It is observed that scaling is