

170
M. M. Aggarwal
13.2.2 Elliptic Flow Measurements and Comparison with
Hydrodynamic Models
In the heavy-ion collisions, events are characterized by the impact parameter “b”
which is, however, not a direct observable. Experimentally, it is determined from
the number of produced particles in a collision assuming that the multiplicity is a
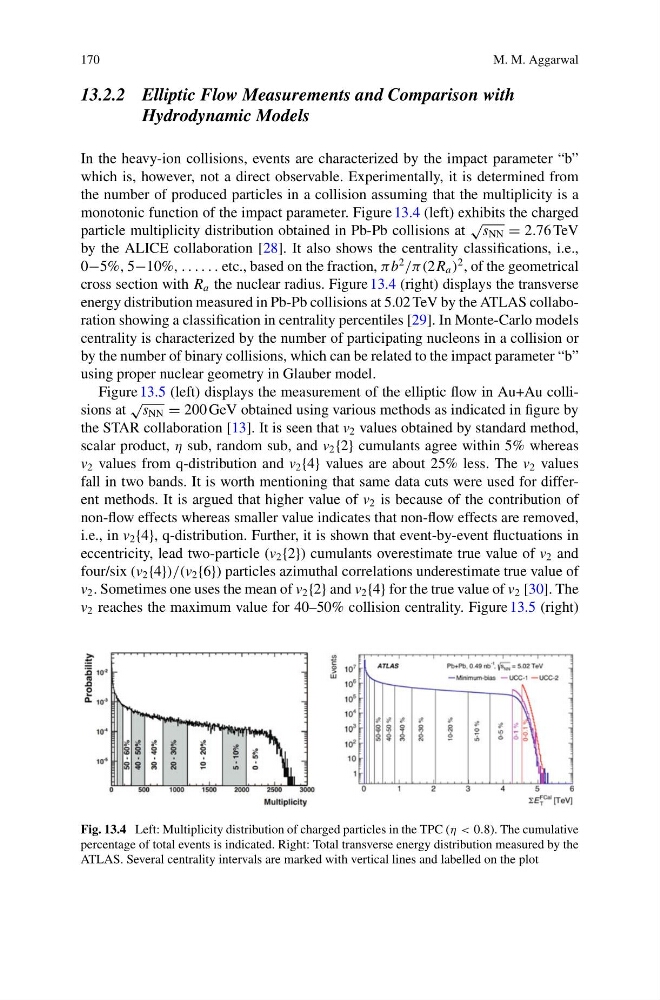
monotonic function of the impact parameter. Figure 13.4 (left) exhibits the charged
particle multiplicity distribution obtained in Pb-Pb collisions at
√ s NN = 2.76 TeV
by the ALICE collaboration [28]. It also shows the centrality classifications, i.e.,
0−5%, 5−10%, . . . . . . etc., based on the fraction, π b
2
/π(2R a )
2 , of the geometrical
cross section with R a the nuclear radius. Figure 13.4 (right) displays the transverse
energy distribution measured in Pb-Pb collisions at 5.02 TeV by the ATLAS collaboration showing a classification in centrality percentiles [29]. In Monte-Carlo models
centrality is characterized by the number of participating nucleons in a collision or
by the number of binary collisions, which can be related to the impact parameter “b”
using proper nuclear geometry in Glauber model.
Figure 13.5 (left) displays the measurement of the elliptic flow in Au+Au collisions at
√
s NN = 200 GeV obtained using various methods as indicated in figure by
the STAR collaboration [13]. It is seen that v 2 values obtained by standard method,
scalar product, η sub, random sub, and v 2 {2} cumulants agree within 5% whereas
v 2 values from q-distribution and v 2 {4} values are about 25% less. The v 2 values
fall in two bands. It is worth mentioning that same data cuts were used for different methods. It is argued that higher value of v 2 is because of the contribution of
non-flow effects whereas smaller value indicates that non-flow effects are removed,
i.e., in v 2 {4}, q-distribution. Further, it is shown that event-by-event fluctuations in
eccentricity, lead two-particle (v 2 {2}) cumulants overestimate true value of v 2 and
four/six (v 2 {4})/(v 2 {6}) particles azimuthal correlations underestimate true value of
v 2 . Sometimes one uses the mean of v 2 {2} and v 2 {4} for the true value of v 2 [30]. The
v 2 reaches the maximum value for 40–50% collision centrality. Figure 13.5 (right)
Fig. 13.4 Left: Multiplicity distribution of charged particles in the TPC (η < 0.8). The cumulative
percentage of total events is indicated. Right: Total transverse energy distribution measured by the
ATLAS. Several centrality intervals are marked with vertical lines and labelled on the plot
M. M. Aggarwal
13.2.2 Elliptic Flow Measurements and Comparison with
Hydrodynamic Models
In the heavy-ion collisions, events are characterized by the impact parameter “b”
which is, however, not a direct observable. Experimentally, it is determined from
the number of produced particles in a collision assuming that the multiplicity is a
monotonic function of the impact parameter. Figure 13.4 (left) exhibits the charged
particle multiplicity distribution obtained in Pb-Pb collisions at
√ s NN = 2.76 TeV
by the ALICE collaboration [28]. It also shows the centrality classifications, i.e.,
0−5%, 5−10%, . . . . . . etc., based on the fraction, π b
2
/π(2R a )
2 , of the geometrical
cross section with R a the nuclear radius. Figure 13.4 (right) displays the transverse
energy distribution measured in Pb-Pb collisions at 5.02 TeV by the ATLAS collaboration showing a classification in centrality percentiles [29]. In Monte-Carlo models
centrality is characterized by the number of participating nucleons in a collision or
by the number of binary collisions, which can be related to the impact parameter “b”
using proper nuclear geometry in Glauber model.
Figure 13.5 (left) displays the measurement of the elliptic flow in Au+Au collisions at
√
s NN = 200 GeV obtained using various methods as indicated in figure by
the STAR collaboration [13]. It is seen that v 2 values obtained by standard method,
scalar product, η sub, random sub, and v 2 {2} cumulants agree within 5% whereas
v 2 values from q-distribution and v 2 {4} values are about 25% less. The v 2 values
fall in two bands. It is worth mentioning that same data cuts were used for different methods. It is argued that higher value of v 2 is because of the contribution of
non-flow effects whereas smaller value indicates that non-flow effects are removed,
i.e., in v 2 {4}, q-distribution. Further, it is shown that event-by-event fluctuations in
eccentricity, lead two-particle (v 2 {2}) cumulants overestimate true value of v 2 and
four/six (v 2 {4})/(v 2 {6}) particles azimuthal correlations underestimate true value of
v 2 . Sometimes one uses the mean of v 2 {2} and v 2 {4} for the true value of v 2 [30]. The
v 2 reaches the maximum value for 40–50% collision centrality. Figure 13.5 (right)
Fig. 13.4 Left: Multiplicity distribution of charged particles in the TPC (η < 0.8). The cumulative
percentage of total events is indicated. Right: Total transverse energy distribution measured by the
ATLAS. Several centrality intervals are marked with vertical lines and labelled on the plot