

5.3 Thermal Technical Characteristics
157
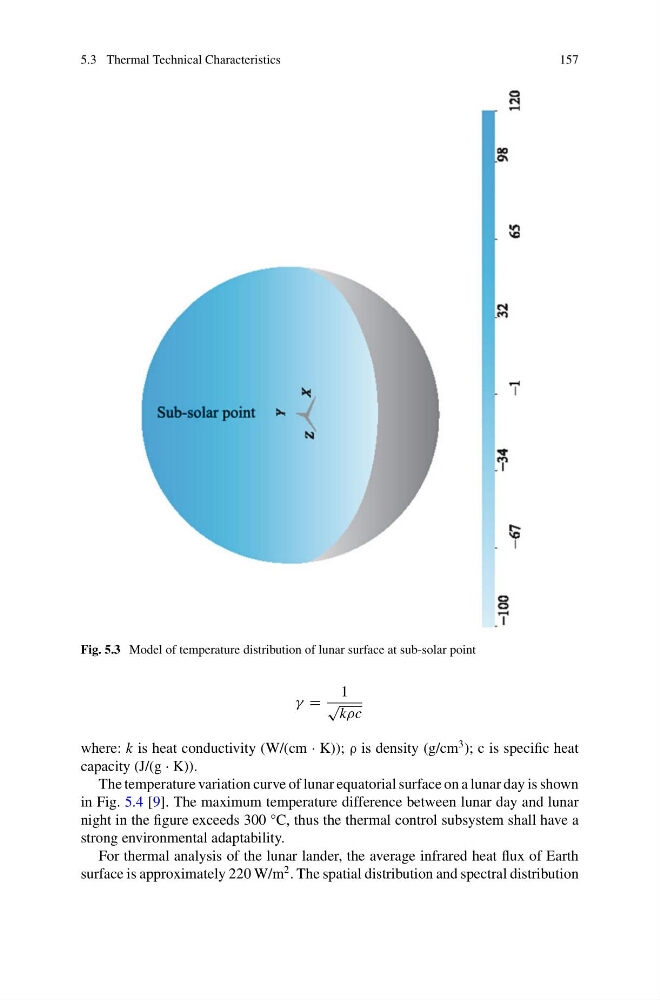
Fig. 5.3 Model of temperature distribution of lunar surface at sub-solar point
γ =
1
√
kρc
where: k is heat conductivity (W/(cm · K)); ρ is density (g/cm
3 ); c is specific heat
capacity (J/(g · K)).
The temperature variation curve of lunar equatorial surface on a lunar day is shown
in Fig. 5.4 [9]. The maximum temperature difference between lunar day and lunar
night in the figure exceeds 300 °C, thus the thermal control subsystem shall have a
strong environmental adaptability.
For thermal analysis of the lunar lander, the average infrared heat flux of Earth
surface is approximately 220 W/m
2 . The spatial distribution and spectral distribution
157
Fig. 5.3 Model of temperature distribution of lunar surface at sub-solar point
γ =
1
√
kρc
where: k is heat conductivity (W/(cm · K)); ρ is density (g/cm
3 ); c is specific heat
capacity (J/(g · K)).
The temperature variation curve of lunar equatorial surface on a lunar day is shown
in Fig. 5.4 [9]. The maximum temperature difference between lunar day and lunar
night in the figure exceeds 300 °C, thus the thermal control subsystem shall have a
strong environmental adaptability.
For thermal analysis of the lunar lander, the average infrared heat flux of Earth
surface is approximately 220 W/m
2 . The spatial distribution and spectral distribution