

7
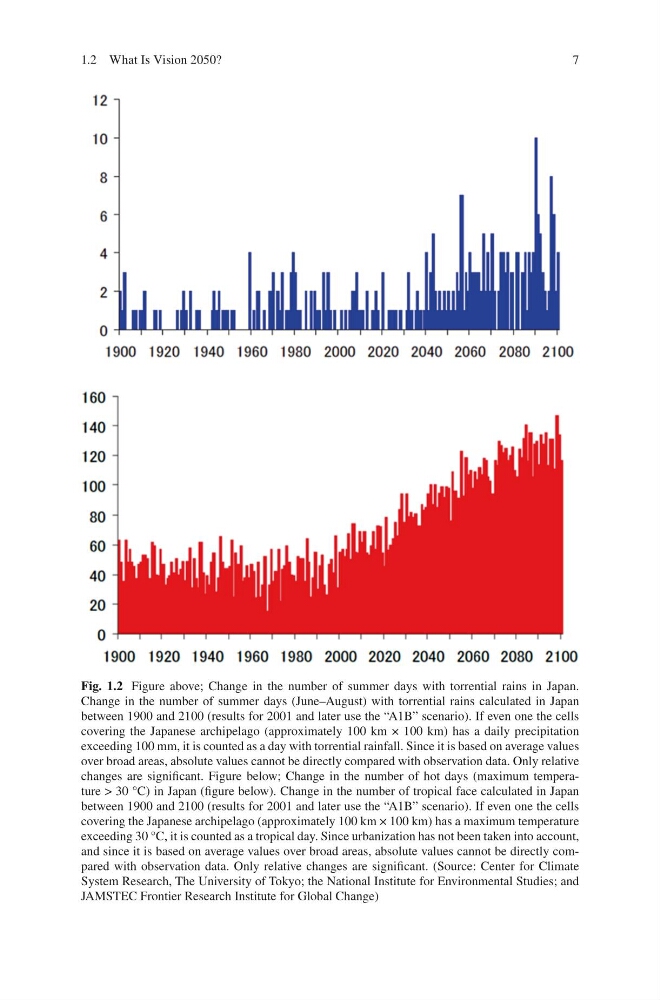
Fig. 1.2 Figure above; Change in the number of summer days with torrential rains in Japan.
Change in the number of summer days (June–August) with torrential rains calculated in Japan
between 1900 and 2100 (results for 2001 and later use the “A1B” scenario). If even one the cells
covering the Japanese archipelago (approximately 100 km × 100 km) has a daily precipitation
exceeding 100 mm, it is counted as a day with torrential rainfall. Since it is based on average values
over broad areas, absolute values cannot be directly compared with observation data. Only relative
changes are significant. Figure below; Change in the number of hot days (maximum temperature > 30 °C) in Japan (figure below). Change in the number of tropical face calculated in Japan
between 1900 and 2100 (results for 2001 and later use the “A1B” scenario). If even one the cells
covering the Japanese archipelago (approximately 100 km × 100 km) has a maximum temperature
exceeding 30 °C, it is counted as a tropical day. Since urbanization has not been taken into account,
and since it is based on average values over broad areas, absolute values cannot be directly compared with observation data. Only relative changes are significant. (Source: Center for Climate
System Research, The University of Tokyo; the National Institute for Environmental Studies; and
JAMSTEC Frontier Research Institute for Global Change)
1.2 What Is Vision 2050?
Fig. 1.2 Figure above; Change in the number of summer days with torrential rains in Japan.
Change in the number of summer days (June–August) with torrential rains calculated in Japan
between 1900 and 2100 (results for 2001 and later use the “A1B” scenario). If even one the cells
covering the Japanese archipelago (approximately 100 km × 100 km) has a daily precipitation
exceeding 100 mm, it is counted as a day with torrential rainfall. Since it is based on average values
over broad areas, absolute values cannot be directly compared with observation data. Only relative
changes are significant. Figure below; Change in the number of hot days (maximum temperature > 30 °C) in Japan (figure below). Change in the number of tropical face calculated in Japan
between 1900 and 2100 (results for 2001 and later use the “A1B” scenario). If even one the cells
covering the Japanese archipelago (approximately 100 km × 100 km) has a maximum temperature
exceeding 30 °C, it is counted as a tropical day. Since urbanization has not been taken into account,
and since it is based on average values over broad areas, absolute values cannot be directly compared with observation data. Only relative changes are significant. (Source: Center for Climate
System Research, The University of Tokyo; the National Institute for Environmental Studies; and
JAMSTEC Frontier Research Institute for Global Change)
1.2 What Is Vision 2050?