

18 Fault Isolation and Failure Analysis of 3D Packaging
611
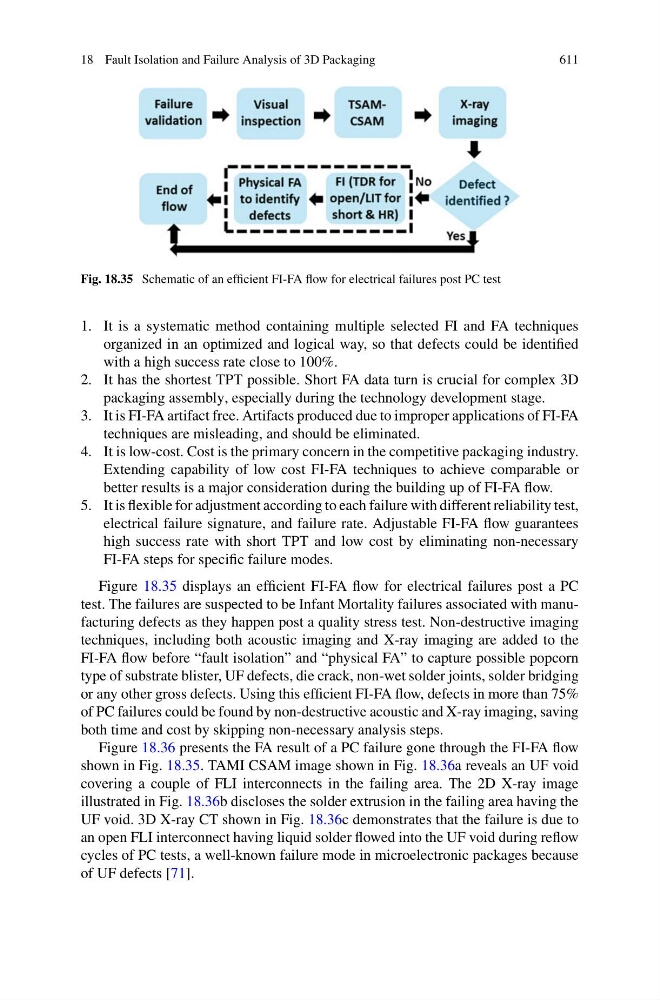
Fig. 18.35 Schematic of an efficient FI-FA flow for electrical failures post PC test
1. It is a systematic method containing multiple selected FI and FA techniques
organized in an optimized and logical way, so that defects could be identified
with a high success rate close to 100%.
2. It has the shortest TPT possible. Short FA data turn is crucial for complex 3D
packaging assembly, especially during the technology development stage.
3. It is FI-FA artifact free. Artifacts produced due to improper applications of FI-FA
techniques are misleading, and should be eliminated.
4. It is low-cost. Cost is the primary concern in the competitive packaging industry.
Extending capability of low cost FI-FA techniques to achieve comparable or
better results is a major consideration during the building up of FI-FA flow.
5. It is flexible for adjustment according to each failure with different reliability test,
electrical failure signature, and failure rate. Adjustable FI-FA flow guarantees
high success rate with short TPT and low cost by eliminating non-necessary
FI-FA steps for specific failure modes.
Figure 18.35 displays an efficient FI-FA flow for electrical failures post a PC
test. The failures are suspected to be Infant Mortality failures associated with manufacturing defects as they happen post a quality stress test. Non-destructive imaging
techniques, including both acoustic imaging and X-ray imaging are added to the
FI-FA flow before “fault isolation” and “physical FA” to capture possible popcorn
type of substrate blister, UF defects, die crack, non-wet solder joints, solder bridging
or any other gross defects. Using this efficient FI-FA flow, defects in more than 75%
of PC failures could be found by non-destructive acoustic and X-ray imaging, saving
both time and cost by skipping non-necessary analysis steps.
Figure 18.36 presents the FA result of a PC failure gone through the FI-FA flow
shown in Fig. 18.35. TAMI CSAM image shown in Fig. 18.36a reveals an UF void
covering a couple of FLI interconnects in the failing area. The 2D X-ray image
illustrated in Fig. 18.36b discloses the solder extrusion in the failing area having the
UF void. 3D X-ray CT shown in Fig. 18.36c demonstrates that the failure is due to
an open FLI interconnect having liquid solder flowed into the UF void during reflow
cycles of PC tests, a well-known failure mode in microelectronic packages because
of UF defects [71].