

18 Fault Isolation and Failure Analysis of 3D Packaging
597
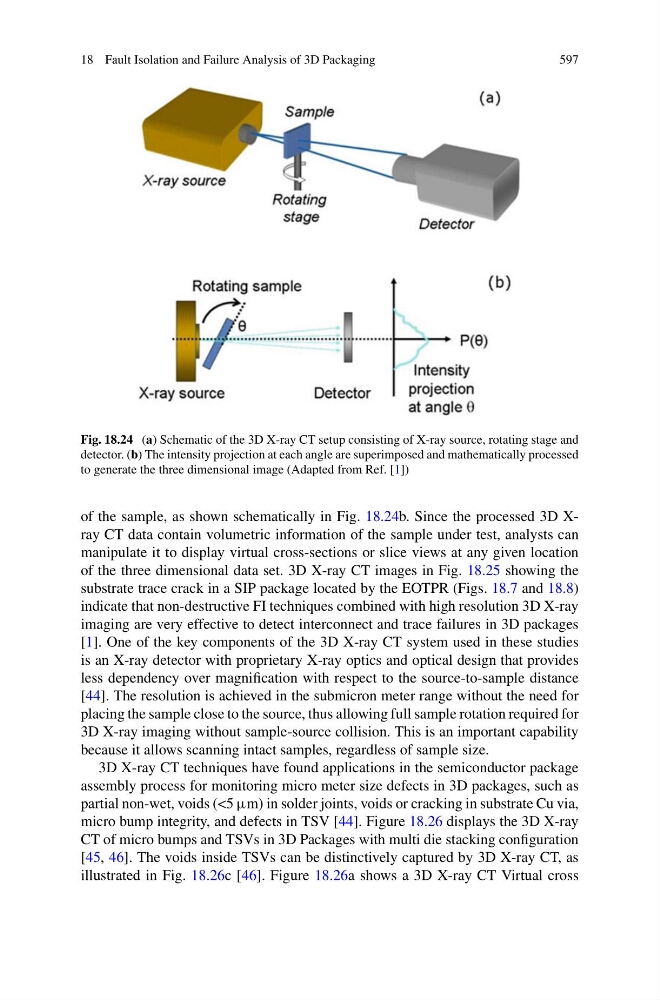
Fig. 18.24 (a) Schematic of the 3D X-ray CT setup consisting of X-ray source, rotating stage and
detector. (b) The intensity projection at each angle are superimposed and mathematically processed
to generate the three dimensional image (Adapted from Ref. [1])
of the sample, as shown schematically in Fig. 18.24b. Since the processed 3D Xray CT data contain volumetric information of the sample under test, analysts can
manipulate it to display virtual cross-sections or slice views at any given location
of the three dimensional data set. 3D X-ray CT images in Fig. 18.25 showing the
substrate trace crack in a SIP package located by the EOTPR (Figs. 18.7 and 18.8)
indicate that non-destructive FI techniques combined with high resolution 3D X-ray
imaging are very effective to detect interconnect and trace failures in 3D packages
[1]. One of the key components of the 3D X-ray CT system used in these studies
is an X-ray detector with proprietary X-ray optics and optical design that provides
less dependency over magnification with respect to the source-to-sample distance
[44]. The resolution is achieved in the submicron meter range without the need for
placing the sample close to the source, thus allowing full sample rotation required for
3D X-ray imaging without sample-source collision. This is an important capability
because it allows scanning intact samples, regardless of sample size.
3D X-ray CT techniques have found applications in the semiconductor package
assembly process for monitoring micro meter size defects in 3D packages, such as
partial non-wet, voids (<5 μm) in solder joints, voids or cracking in substrate Cu via,
micro bump integrity, and defects in TSV [44]. Figure 18.26 displays the 3D X-ray
CT of micro bumps and TSVs in 3D Packages with multi die stacking configuration
[45, 46]. The voids inside TSVs can be distinctively captured by 3D X-ray CT, as
illustrated in Fig. 18.26c [46]. Figure 18.26a shows a 3D X-ray CT Virtual cross