

592
Y. Li and D. Goyal
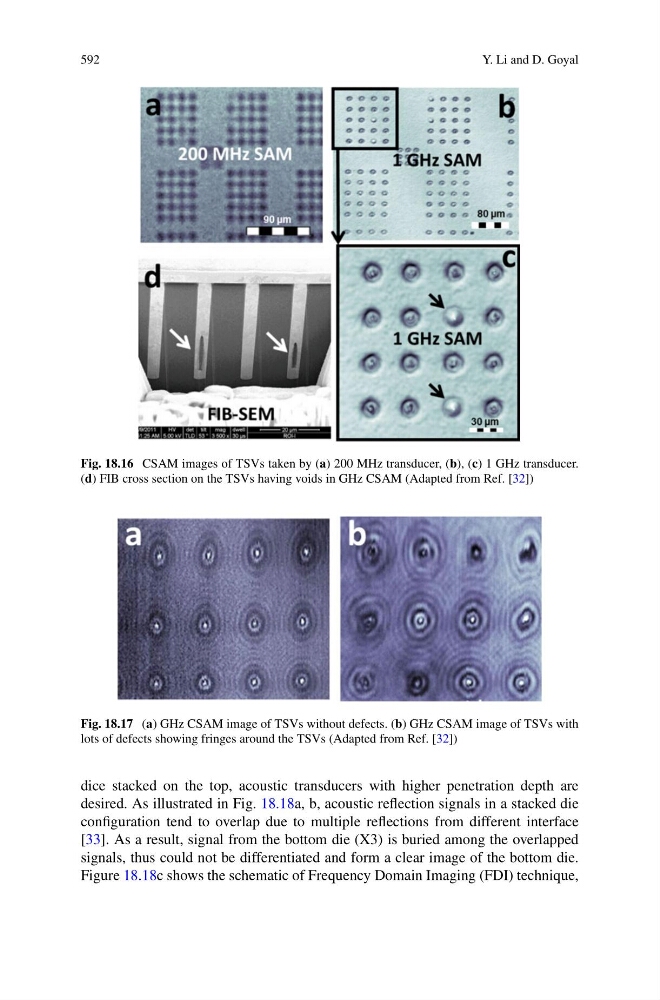
Fig. 18.16 CSAM images of TSVs taken by (a) 200 MHz transducer, (b), (c) 1 GHz transducer.
(d) FIB cross section on the TSVs having voids in GHz CSAM (Adapted from Ref. [32])
Fig. 18.17 (a) GHz CSAM image of TSVs without defects. (b) GHz CSAM image of TSVs with
lots of defects showing fringes around the TSVs (Adapted from Ref. [32])
dice stacked on the top, acoustic transducers with higher penetration depth are
desired. As illustrated in Fig. 18.18a, b, acoustic reflection signals in a stacked die
configuration tend to overlap due to multiple reflections from different interface
[33]. As a result, signal from the bottom die (X3) is buried among the overlapped
signals, thus could not be differentiated and form a clear image of the bottom die.
Figure 18.18c shows the schematic of Frequency Domain Imaging (FDI) technique,