

18 Fault Isolation and Failure Analysis of 3D Packaging
593
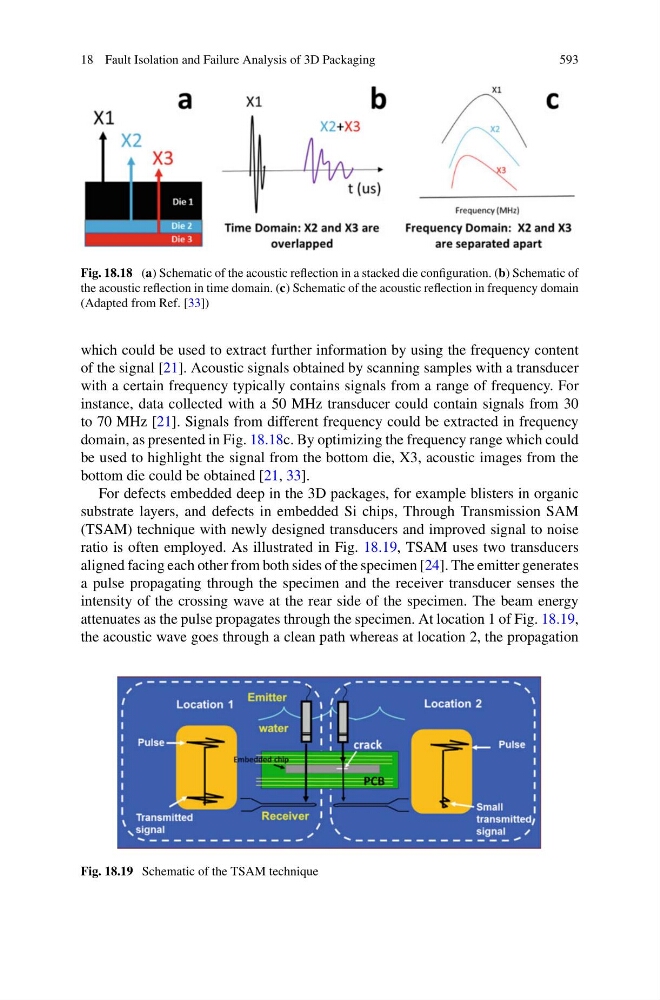
Fig. 18.18 (a) Schematic of the acoustic reflection in a stacked die configuration. (b) Schematic of
the acoustic reflection in time domain. (c) Schematic of the acoustic reflection in frequency domain
(Adapted from Ref. [33])
which could be used to extract further information by using the frequency content
of the signal [21]. Acoustic signals obtained by scanning samples with a transducer
with a certain frequency typically contains signals from a range of frequency. For
instance, data collected with a 50 MHz transducer could contain signals from 30
to 70 MHz [21]. Signals from different frequency could be extracted in frequency
domain, as presented in Fig. 18.18c. By optimizing the frequency range which could
be used to highlight the signal from the bottom die, X3, acoustic images from the
bottom die could be obtained [21, 33].
For defects embedded deep in the 3D packages, for example blisters in organic
substrate layers, and defects in embedded Si chips, Through Transmission SAM
(TSAM) technique with newly designed transducers and improved signal to noise
ratio is often employed. As illustrated in Fig. 18.19, TSAM uses two transducers
aligned facing each other from both sides of the specimen [24]. The emitter generates
a pulse propagating through the specimen and the receiver transducer senses the
intensity of the crossing wave at the rear side of the specimen. The beam energy
attenuates as the pulse propagates through the specimen. At location 1 of Fig. 18.19,
the acoustic wave goes through a clean path whereas at location 2, the propagation
Fig. 18.19 Schematic of the TSAM technique