

18 Fault Isolation and Failure Analysis of 3D Packaging
591
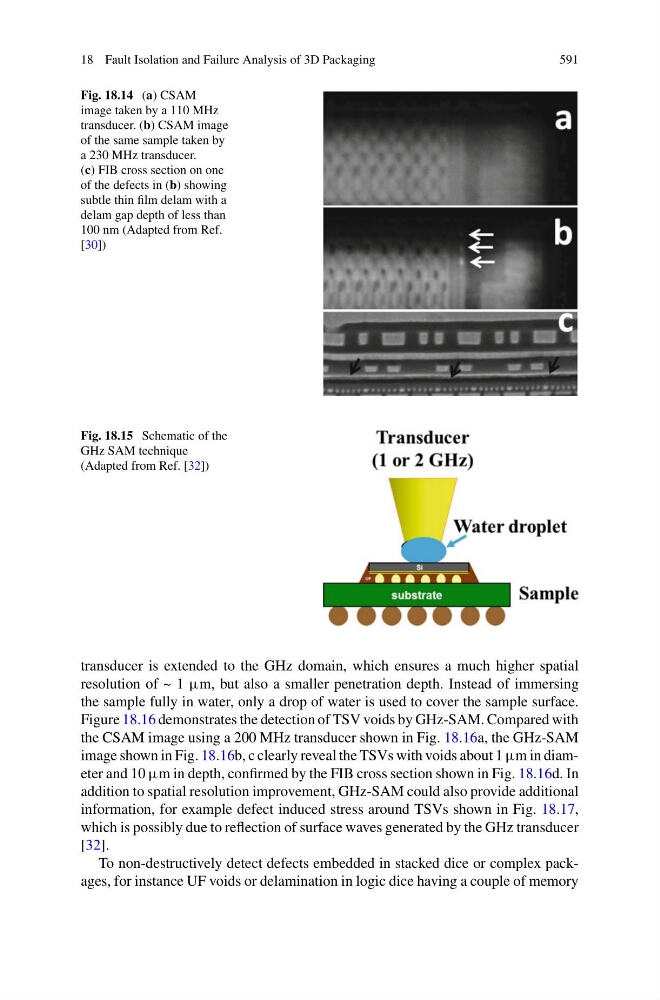
Fig. 18.14 (a) CSAM
image taken by a 110 MHz
transducer. (b) CSAM image
of the same sample taken by
a 230 MHz transducer.
(c) FIB cross section on one
of the defects in (b) showing
subtle thin film delam with a
delam gap depth of less than
100 nm (Adapted from Ref.
[30])
Fig. 18.15 Schematic of the
GHz SAM technique
(Adapted from Ref. [32])
transducer is extended to the GHz domain, which ensures a much higher spatial
resolution of ~ 1 μm, but also a smaller penetration depth. Instead of immersing
the sample fully in water, only a drop of water is used to cover the sample surface.
Figure 18.16 demonstrates the detection of TSV voids by GHz-SAM. Compared with
the CSAM image using a 200 MHz transducer shown in Fig. 18.16a, the GHz-SAM
image shown in Fig. 18.16b, c clearly reveal the TSVs with voids about 1 μm in diameter and 10 μm in depth, confirmed by the FIB cross section shown in Fig. 18.16d. In
addition to spatial resolution improvement, GHz-SAM could also provide additional
information, for example defect induced stress around TSVs shown in Fig. 18.17,
which is possibly due to reflection of surface waves generated by the GHz transducer
[32].
To non-destructively detect defects embedded in stacked dice or complex packages, for instance UF voids or delamination in logic dice having a couple of memory