

554
Y. Wang et al.
17.5.1.1 Back Stress
Among all the experimental studies of EM in Al interconnects, a couple of them
deserve mentioning. One is the addition of Cu to Al lines to retard EM, and the other
is the use Al short stripes designed by I. A. Blech for a direct observation of EM
and the finding of the effect of back-stress. In the latter, short stripes of Al were
deposited onto a titanium nitride (TiN) film and stressed at a high current density.
As Al resistivity was much lower than that of the TiN layer, the short stripes would
carry most of the current, which result in the transportation of Al atoms from the
cathode to the anode. It leads to the formation of void at cathode and hillock at the
anode, which become observable and in turn measurable for quantitative analysis
of the driving force of EM. Furthermore, it was found that the longer the stripe, the
more the depletion at the cathode side in EM. This was explained by the back-stress
below [35, 36].
The transport of Al atoms from the cathode to the anode will lead to compression
in the latter and tension in the former. According to Nabarro-Herring model of creep
where the equilibrium vacancy concentration is affected by the stress potential (σ);
the tensile region has more vacancies and the compressive region has lesser vacancies
than the unstressed region, so there is a vacancy gradient crossing the cathode to the
anode. This gradient will induce an atomic flux of Al going from anode to cathode,
which is opposite to the EM flux of Al. The vacancy concentration gradient depends
on the length of Al stripe, and the shorter the stripe, the greater the gradient. At
a certain short length defined as the critical length, the gradient is large enough to
balance EM, so that no depletion at the cathode and no extrusion at the anode occur.
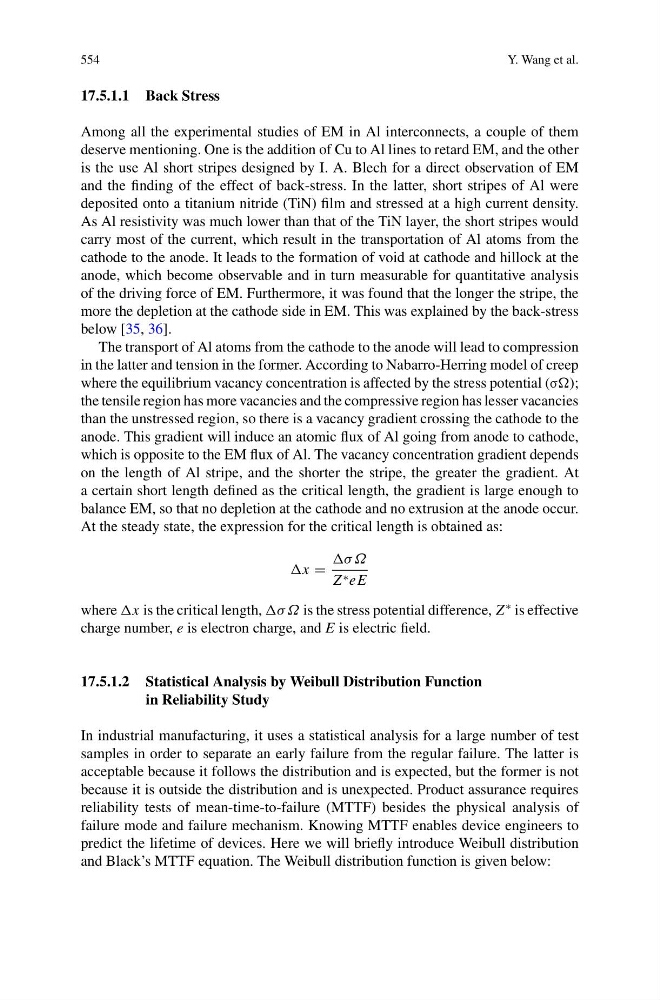
At the steady state, the expression for the critical length is obtained as:
x =
Ω
Z ∗ eE
where x is the critical length, σ Ω is the stress potential difference, Z
∗ is effective
charge number, e is electron charge, and E is electric field.
17.5.1.2 Statistical Analysis by Weibull Distribution Function
in Reliability Study
In industrial manufacturing, it uses a statistical analysis for a large number of test
samples in order to separate an early failure from the regular failure. The latter is
acceptable because it follows the distribution and is expected, but the former is not
because it is outside the distribution and is unexpected. Product assurance requires
reliability tests of mean-time-to-failure (MTTF) besides the physical analysis of
failure mode and failure mechanism. Knowing MTTF enables device engineers to
predict the lifetime of devices. Here we will briefly introduce Weibull distribution
and Black’s MTTF equation. The Weibull distribution function is given below:
Y. Wang et al.
17.5.1.1 Back Stress
Among all the experimental studies of EM in Al interconnects, a couple of them
deserve mentioning. One is the addition of Cu to Al lines to retard EM, and the other
is the use Al short stripes designed by I. A. Blech for a direct observation of EM
and the finding of the effect of back-stress. In the latter, short stripes of Al were
deposited onto a titanium nitride (TiN) film and stressed at a high current density.
As Al resistivity was much lower than that of the TiN layer, the short stripes would
carry most of the current, which result in the transportation of Al atoms from the
cathode to the anode. It leads to the formation of void at cathode and hillock at the
anode, which become observable and in turn measurable for quantitative analysis
of the driving force of EM. Furthermore, it was found that the longer the stripe, the
more the depletion at the cathode side in EM. This was explained by the back-stress
below [35, 36].
The transport of Al atoms from the cathode to the anode will lead to compression
in the latter and tension in the former. According to Nabarro-Herring model of creep
where the equilibrium vacancy concentration is affected by the stress potential (σ);
the tensile region has more vacancies and the compressive region has lesser vacancies
than the unstressed region, so there is a vacancy gradient crossing the cathode to the
anode. This gradient will induce an atomic flux of Al going from anode to cathode,
which is opposite to the EM flux of Al. The vacancy concentration gradient depends
on the length of Al stripe, and the shorter the stripe, the greater the gradient. At
a certain short length defined as the critical length, the gradient is large enough to
balance EM, so that no depletion at the cathode and no extrusion at the anode occur.
At the steady state, the expression for the critical length is obtained as:
x =
Ω
Z ∗ eE
where x is the critical length, σ Ω is the stress potential difference, Z
∗ is effective
charge number, e is electron charge, and E is electric field.
17.5.1.2 Statistical Analysis by Weibull Distribution Function
in Reliability Study
In industrial manufacturing, it uses a statistical analysis for a large number of test
samples in order to separate an early failure from the regular failure. The latter is
acceptable because it follows the distribution and is expected, but the former is not
because it is outside the distribution and is unexpected. Product assurance requires
reliability tests of mean-time-to-failure (MTTF) besides the physical analysis of
failure mode and failure mechanism. Knowing MTTF enables device engineers to
predict the lifetime of devices. Here we will briefly introduce Weibull distribution
and Black’s MTTF equation. The Weibull distribution function is given below: