

17 Interconnect Quality and Reliability of 3D Packaging
551
-60
-30
0
30
60
90
120
150
180
0
900 1800 2700 3600 4500 5400 6300 7200
Time (s)
Temperature (
o
C)
0-100
0-125
-55-110
-40-125
-40-150
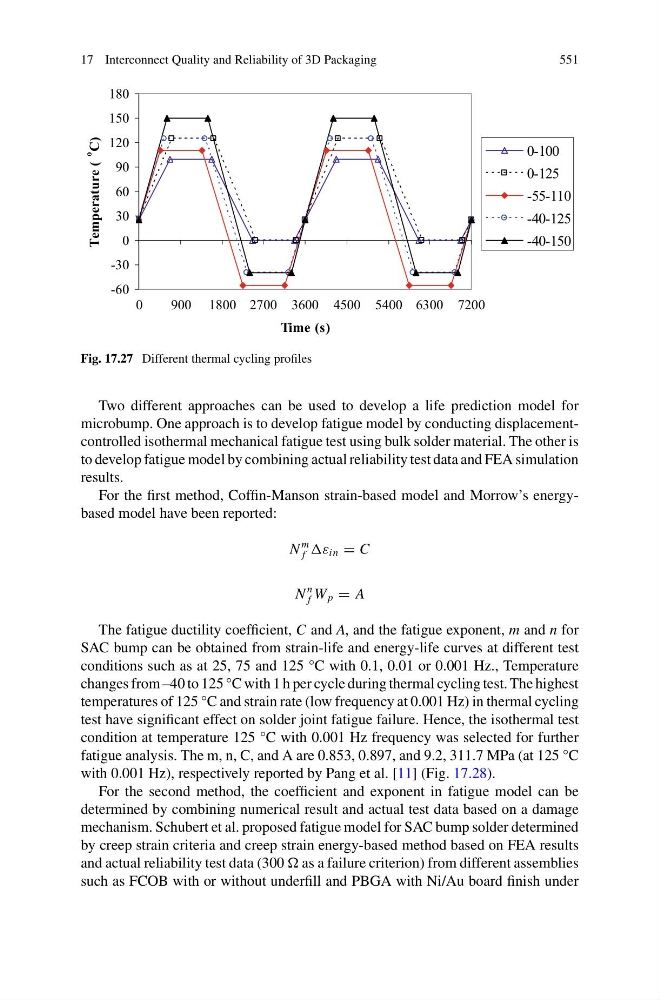
Fig. 17.27 Different thermal cycling profiles
Two different approaches can be used to develop a life prediction model for
microbump. One approach is to develop fatigue model by conducting displacementcontrolled isothermal mechanical fatigue test using bulk solder material. The other is
to develop fatigue model by combining actual reliability test data and FEA simulation
results.
For the first method, Coffin-Manson strain-based model and Morrow’s energybased model have been reported:
N
m
f ε in = C
N
n
f W p = A
The fatigue ductility coefficient, C and A, and the fatigue exponent, m and n for
SAC bump can be obtained from strain-life and energy-life curves at different test
conditions such as at 25, 75 and 125 °C with 0.1, 0.01 or 0.001 Hz., Temperature
changes from –40 to 125 °C with 1 h per cycle during thermal cycling test. The highest
temperatures of 125 °C and strain rate (low frequency at 0.001 Hz) in thermal cycling
test have significant effect on solder joint fatigue failure. Hence, the isothermal test
condition at temperature 125 °C with 0.001 Hz frequency was selected for further
fatigue analysis. The m, n, C, and A are 0.853, 0.897, and 9.2, 311.7 MPa (at 125 °C
with 0.001 Hz), respectively reported by Pang et al. [11] (Fig. 17.28).
For the second method, the coefficient and exponent in fatigue model can be
determined by combining numerical result and actual test data based on a damage
mechanism. Schubert et al. proposed fatigue model for SAC bump solder determined
by creep strain criteria and creep strain energy-based method based on FEA results
and actual reliability test data (300 as a failure criterion) from different assemblies
such as FCOB with or without underfill and PBGA with Ni/Au board finish under
551
-60
-30
0
30
60
90
120
150
180
0
900 1800 2700 3600 4500 5400 6300 7200
Time (s)
Temperature (
o
C)
0-100
0-125
-55-110
-40-125
-40-150
Fig. 17.27 Different thermal cycling profiles
Two different approaches can be used to develop a life prediction model for
microbump. One approach is to develop fatigue model by conducting displacementcontrolled isothermal mechanical fatigue test using bulk solder material. The other is
to develop fatigue model by combining actual reliability test data and FEA simulation
results.
For the first method, Coffin-Manson strain-based model and Morrow’s energybased model have been reported:
N
m
f ε in = C
N
n
f W p = A
The fatigue ductility coefficient, C and A, and the fatigue exponent, m and n for
SAC bump can be obtained from strain-life and energy-life curves at different test
conditions such as at 25, 75 and 125 °C with 0.1, 0.01 or 0.001 Hz., Temperature
changes from –40 to 125 °C with 1 h per cycle during thermal cycling test. The highest
temperatures of 125 °C and strain rate (low frequency at 0.001 Hz) in thermal cycling
test have significant effect on solder joint fatigue failure. Hence, the isothermal test
condition at temperature 125 °C with 0.001 Hz frequency was selected for further
fatigue analysis. The m, n, C, and A are 0.853, 0.897, and 9.2, 311.7 MPa (at 125 °C
with 0.001 Hz), respectively reported by Pang et al. [11] (Fig. 17.28).
For the second method, the coefficient and exponent in fatigue model can be
determined by combining numerical result and actual test data based on a damage
mechanism. Schubert et al. proposed fatigue model for SAC bump solder determined
by creep strain criteria and creep strain energy-based method based on FEA results
and actual reliability test data (300 as a failure criterion) from different assemblies
such as FCOB with or without underfill and PBGA with Ni/Au board finish under