

17 Interconnect Quality and Reliability of 3D Packaging
547
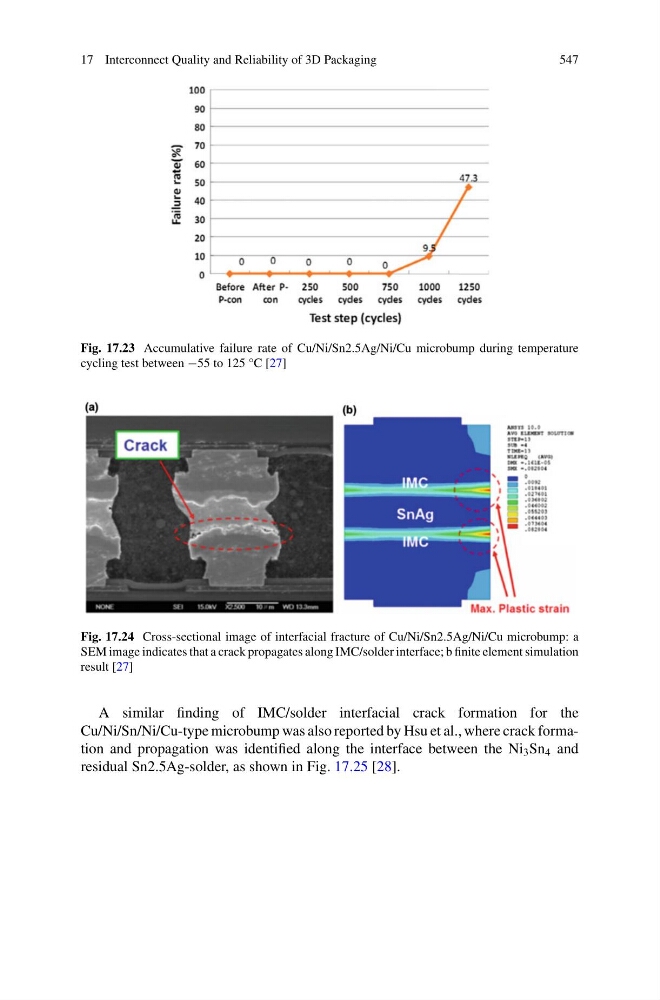
Fig. 17.23 Accumulative failure rate of Cu/Ni/Sn2.5Ag/Ni/Cu microbump during temperature
cycling test between −55 to 125 °C [27]
Fig. 17.24 Cross-sectional image of interfacial fracture of Cu/Ni/Sn2.5Ag/Ni/Cu microbump: a
SEM image indicates that a crack propagates along IMC/solder interface; b finite element simulation
result [27]
A similar finding of IMC/solder interfacial crack formation for the
Cu/Ni/Sn/Ni/Cu-type microbump was also reported by Hsu et al., where crack formation and propagation was identified along the interface between the Ni 3 Sn 4 and
residual Sn2.5Ag-solder, as shown in Fig. 17.25 [28].
547
Fig. 17.23 Accumulative failure rate of Cu/Ni/Sn2.5Ag/Ni/Cu microbump during temperature
cycling test between −55 to 125 °C [27]
Fig. 17.24 Cross-sectional image of interfacial fracture of Cu/Ni/Sn2.5Ag/Ni/Cu microbump: a
SEM image indicates that a crack propagates along IMC/solder interface; b finite element simulation
result [27]
A similar finding of IMC/solder interfacial crack formation for the
Cu/Ni/Sn/Ni/Cu-type microbump was also reported by Hsu et al., where crack formation and propagation was identified along the interface between the Ni 3 Sn 4 and
residual Sn2.5Ag-solder, as shown in Fig. 17.25 [28].