

16 Processing and Reliability of Solder Interconnections …
521
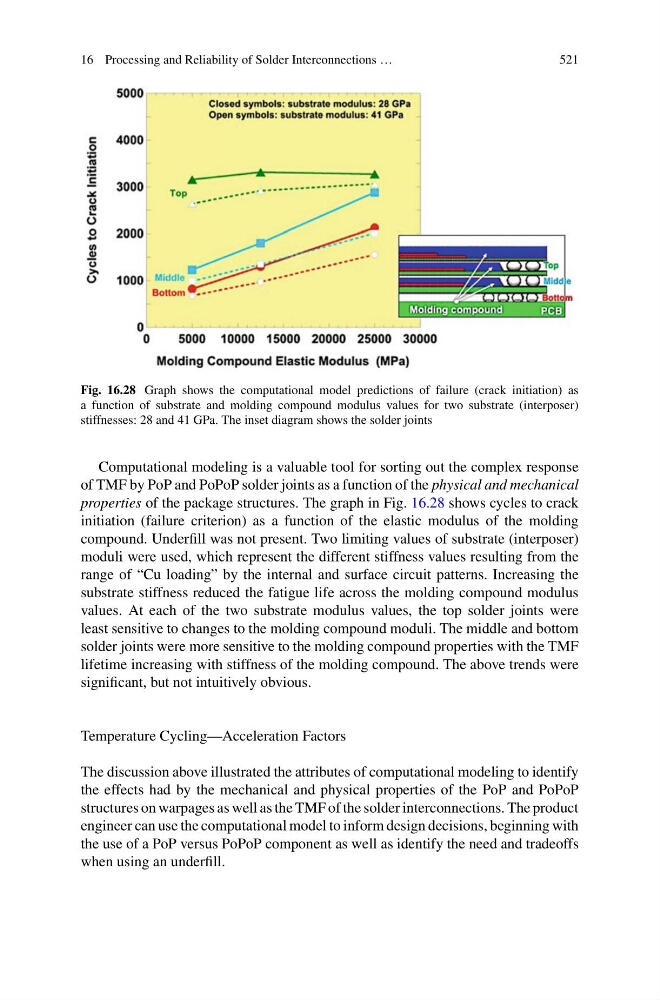
Fig. 16.28 Graph shows the computational model predictions of failure (crack initiation) as
a function of substrate and molding compound modulus values for two substrate (interposer)
stiffnesses: 28 and 41 GPa. The inset diagram shows the solder joints
Computational modeling is a valuable tool for sorting out the complex response
of TMF by PoP and PoPoP solder joints as a function of the physical and mechanical
properties of the package structures. The graph in Fig. 16.28 shows cycles to crack
initiation (failure criterion) as a function of the elastic modulus of the molding
compound. Underfill was not present. Two limiting values of substrate (interposer)
moduli were used, which represent the different stiffness values resulting from the
range of “Cu loading” by the internal and surface circuit patterns. Increasing the
substrate stiffness reduced the fatigue life across the molding compound modulus
values. At each of the two substrate modulus values, the top solder joints were
least sensitive to changes to the molding compound moduli. The middle and bottom
solder joints were more sensitive to the molding compound properties with the TMF
lifetime increasing with stiffness of the molding compound. The above trends were
significant, but not intuitively obvious.
Temperature Cycling—Acceleration Factors
The discussion above illustrated the attributes of computational modeling to identify
the effects had by the mechanical and physical properties of the PoP and PoPoP
structures on warpages as well as the TMF of the solder interconnections. The product
engineer can use the computational model to inform design decisions, beginning with
the use of a PoP versus PoPoP component as well as identify the need and tradeoffs
when using an underfill.
521
Fig. 16.28 Graph shows the computational model predictions of failure (crack initiation) as
a function of substrate and molding compound modulus values for two substrate (interposer)
stiffnesses: 28 and 41 GPa. The inset diagram shows the solder joints
Computational modeling is a valuable tool for sorting out the complex response
of TMF by PoP and PoPoP solder joints as a function of the physical and mechanical
properties of the package structures. The graph in Fig. 16.28 shows cycles to crack
initiation (failure criterion) as a function of the elastic modulus of the molding
compound. Underfill was not present. Two limiting values of substrate (interposer)
moduli were used, which represent the different stiffness values resulting from the
range of “Cu loading” by the internal and surface circuit patterns. Increasing the
substrate stiffness reduced the fatigue life across the molding compound modulus
values. At each of the two substrate modulus values, the top solder joints were
least sensitive to changes to the molding compound moduli. The middle and bottom
solder joints were more sensitive to the molding compound properties with the TMF
lifetime increasing with stiffness of the molding compound. The above trends were
significant, but not intuitively obvious.
Temperature Cycling—Acceleration Factors
The discussion above illustrated the attributes of computational modeling to identify
the effects had by the mechanical and physical properties of the PoP and PoPoP
structures on warpages as well as the TMF of the solder interconnections. The product
engineer can use the computational model to inform design decisions, beginning with
the use of a PoP versus PoPoP component as well as identify the need and tradeoffs
when using an underfill.