

522
P. Vianco and M. Neilsen
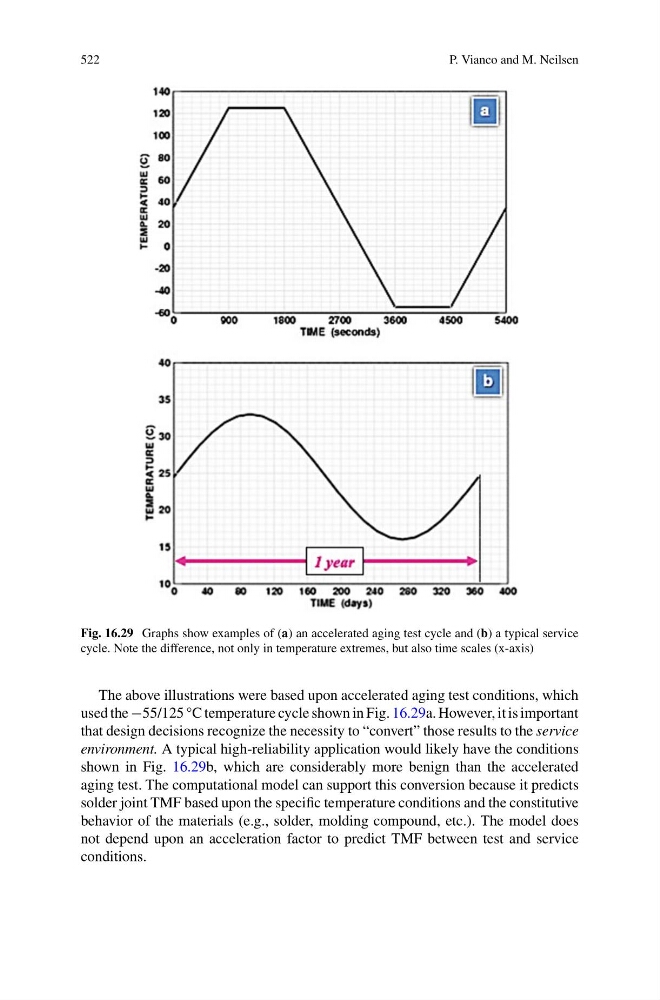
Fig. 16.29 Graphs show examples of (a) an accelerated aging test cycle and (b) a typical service
cycle. Note the difference, not only in temperature extremes, but also time scales (x-axis)
The above illustrations were based upon accelerated aging test conditions, which
used the −55/125 °C temperature cycle shown in Fig. 16.29a. However, it is important
that design decisions recognize the necessity to “convert” those results to the service
environment. A typical high-reliability application would likely have the conditions
shown in Fig. 16.29b, which are considerably more benign than the accelerated
aging test. The computational model can support this conversion because it predicts
solder joint TMF based upon the specific temperature conditions and the constitutive
behavior of the materials (e.g., solder, molding compound, etc.). The model does
not depend upon an acceleration factor to predict TMF between test and service
conditions.
P. Vianco and M. Neilsen
Fig. 16.29 Graphs show examples of (a) an accelerated aging test cycle and (b) a typical service
cycle. Note the difference, not only in temperature extremes, but also time scales (x-axis)
The above illustrations were based upon accelerated aging test conditions, which
used the −55/125 °C temperature cycle shown in Fig. 16.29a. However, it is important
that design decisions recognize the necessity to “convert” those results to the service
environment. A typical high-reliability application would likely have the conditions
shown in Fig. 16.29b, which are considerably more benign than the accelerated
aging test. The computational model can support this conversion because it predicts
solder joint TMF based upon the specific temperature conditions and the constitutive
behavior of the materials (e.g., solder, molding compound, etc.). The model does
not depend upon an acceleration factor to predict TMF between test and service
conditions.