

16 Processing and Reliability of Solder Interconnections …
519
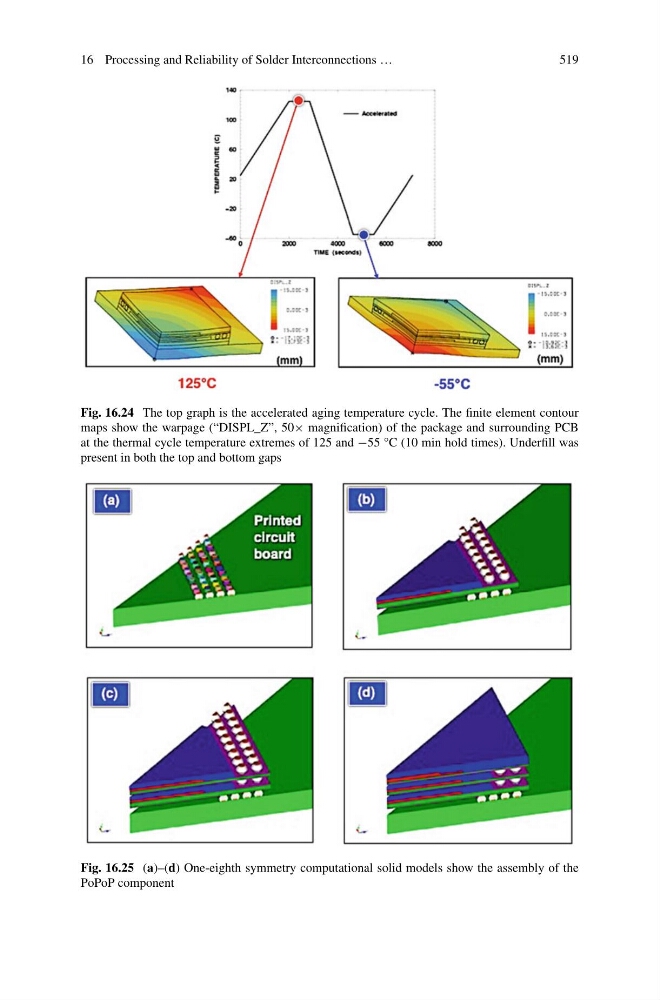
Fig. 16.24 The top graph is the accelerated aging temperature cycle. The finite element contour
maps show the warpage (“DISPL_Z”, 50× magnification) of the package and surrounding PCB
at the thermal cycle temperature extremes of 125 and −55 °C (10 min hold times). Underfill was
present in both the top and bottom gaps
Fig. 16.25 (a)–(d) One-eighth symmetry computational solid models show the assembly of the
PoPoP component
519
Fig. 16.24 The top graph is the accelerated aging temperature cycle. The finite element contour
maps show the warpage (“DISPL_Z”, 50× magnification) of the package and surrounding PCB
at the thermal cycle temperature extremes of 125 and −55 °C (10 min hold times). Underfill was
present in both the top and bottom gaps
Fig. 16.25 (a)–(d) One-eighth symmetry computational solid models show the assembly of the
PoPoP component