

514
P. Vianco and M. Neilsen
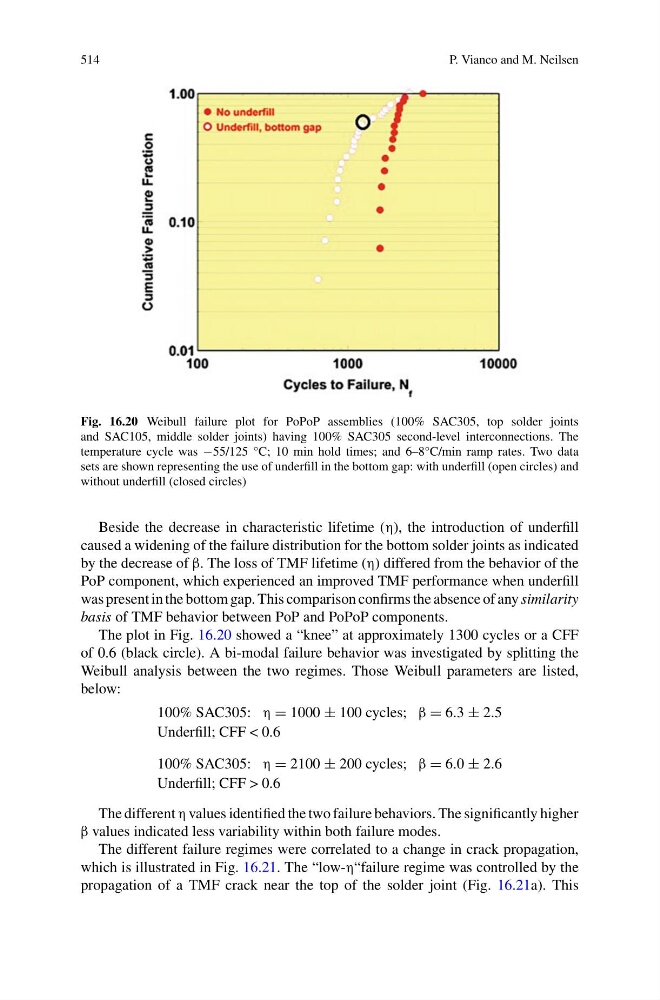
Fig. 16.20 Weibull failure plot for PoPoP assemblies (100% SAC305, top solder joints
and SAC105, middle solder joints) having 100% SAC305 second-level interconnections. The
temperature cycle was −55/125 °C; 10 min hold times; and 6–8°C/min ramp rates. Two data
sets are shown representing the use of underfill in the bottom gap: with underfill (open circles) and
without underfill (closed circles)
Beside the decrease in characteristic lifetime (η), the introduction of underfill
caused a widening of the failure distribution for the bottom solder joints as indicated
by the decrease of β. The loss of TMF lifetime (η) differed from the behavior of the
PoP component, which experienced an improved TMF performance when underfill
was present in the bottom gap. This comparison confirms the absence of any similarity
basis of TMF behavior between PoP and PoPoP components.
The plot in Fig. 16.20 showed a “knee” at approximately 1300 cycles or a CFF
of 0.6 (black circle). A bi-modal failure behavior was investigated by splitting the
Weibull analysis between the two regimes. Those Weibull parameters are listed,
below:
100% SAC305: η = 1000 ± 100 cycles; β = 6.3 ± 2.5
Underfill; CFF < 0.6
100% SAC305: η = 2100 ± 200 cycles; β = 6.0 ± 2.6
Underfill; CFF > 0.6
The different η values identified the two failure behaviors. The significantly higher
β values indicated less variability within both failure modes.
The different failure regimes were correlated to a change in crack propagation,
which is illustrated in Fig. 16.21. The “low-η“failure regime was controlled by the
propagation of a TMF crack near the top of the solder joint (Fig. 16.21a). This
P. Vianco and M. Neilsen
Fig. 16.20 Weibull failure plot for PoPoP assemblies (100% SAC305, top solder joints
and SAC105, middle solder joints) having 100% SAC305 second-level interconnections. The
temperature cycle was −55/125 °C; 10 min hold times; and 6–8°C/min ramp rates. Two data
sets are shown representing the use of underfill in the bottom gap: with underfill (open circles) and
without underfill (closed circles)
Beside the decrease in characteristic lifetime (η), the introduction of underfill
caused a widening of the failure distribution for the bottom solder joints as indicated
by the decrease of β. The loss of TMF lifetime (η) differed from the behavior of the
PoP component, which experienced an improved TMF performance when underfill
was present in the bottom gap. This comparison confirms the absence of any similarity
basis of TMF behavior between PoP and PoPoP components.
The plot in Fig. 16.20 showed a “knee” at approximately 1300 cycles or a CFF
of 0.6 (black circle). A bi-modal failure behavior was investigated by splitting the
Weibull analysis between the two regimes. Those Weibull parameters are listed,
below:
100% SAC305: η = 1000 ± 100 cycles; β = 6.3 ± 2.5
Underfill; CFF < 0.6
100% SAC305: η = 2100 ± 200 cycles; β = 6.0 ± 2.6
Underfill; CFF > 0.6
The different η values identified the two failure behaviors. The significantly higher
β values indicated less variability within both failure modes.
The different failure regimes were correlated to a change in crack propagation,
which is illustrated in Fig. 16.21. The “low-η“failure regime was controlled by the
propagation of a TMF crack near the top of the solder joint (Fig. 16.21a). This