

16 Processing and Reliability of Solder Interconnections …
505
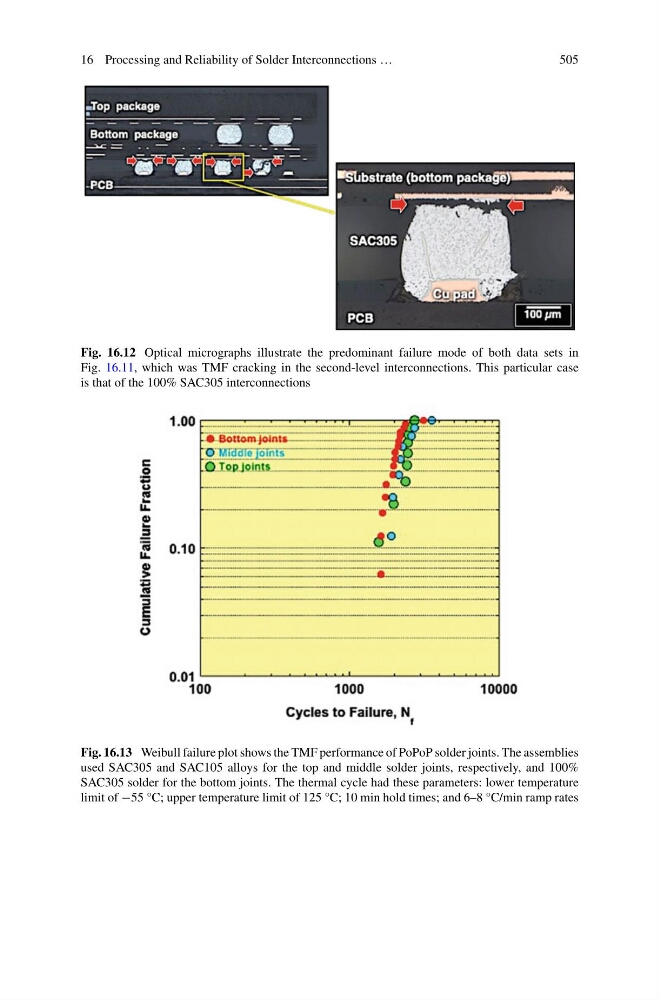
Fig. 16.12 Optical micrographs illustrate the predominant failure mode of both data sets in
Fig. 16.11, which was TMF cracking in the second-level interconnections. This particular case
is that of the 100% SAC305 interconnections
Fig. 16.13 Weibull failure plot shows the TMF performance of PoPoP solder joints. The assemblies
used SAC305 and SAC105 alloys for the top and middle solder joints, respectively, and 100%
SAC305 solder for the bottom joints. The thermal cycle had these parameters: lower temperature
limit of −55 °C; upper temperature limit of 125 °C; 10 min hold times; and 6–8 °C/min ramp rates
505
Fig. 16.12 Optical micrographs illustrate the predominant failure mode of both data sets in
Fig. 16.11, which was TMF cracking in the second-level interconnections. This particular case
is that of the 100% SAC305 interconnections
Fig. 16.13 Weibull failure plot shows the TMF performance of PoPoP solder joints. The assemblies
used SAC305 and SAC105 alloys for the top and middle solder joints, respectively, and 100%
SAC305 solder for the bottom joints. The thermal cycle had these parameters: lower temperature
limit of −55 °C; upper temperature limit of 125 °C; 10 min hold times; and 6–8 °C/min ramp rates