

506
P. Vianco and M. Neilsen
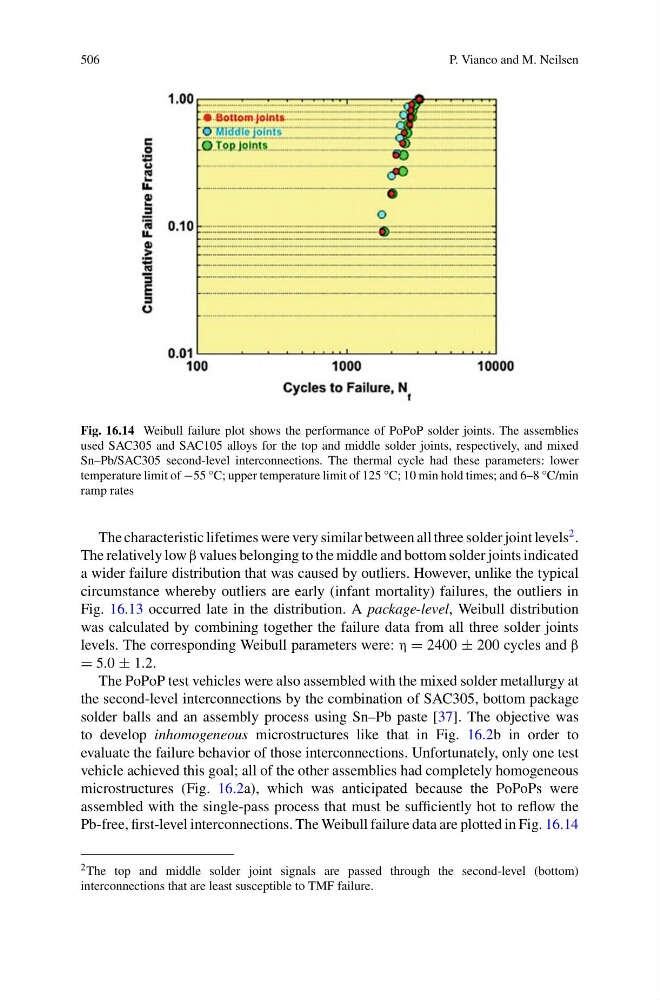
Fig. 16.14 Weibull failure plot shows the performance of PoPoP solder joints. The assemblies
used SAC305 and SAC105 alloys for the top and middle solder joints, respectively, and mixed
Sn–Pb/SAC305 second-level interconnections. The thermal cycle had these parameters: lower
temperature limit of −55 °C; upper temperature limit of 125 °C; 10 min hold times; and 6–8 °C/min
ramp rates
The characteristic lifetimes were very similar between all three solder joint levels
2 .
The relatively low β values belonging to the middle and bottom solder joints indicated
a wider failure distribution that was caused by outliers. However, unlike the typical
circumstance whereby outliers are early (infant mortality) failures, the outliers in
Fig. 16.13 occurred late in the distribution. A package-level, Weibull distribution
was calculated by combining together the failure data from all three solder joints
levels. The corresponding Weibull parameters were: η = 2400 ± 200 cycles and β
= 5.0 ± 1.2.
The PoPoP test vehicles were also assembled with the mixed solder metallurgy at
the second-level interconnections by the combination of SAC305, bottom package
solder balls and an assembly process using Sn–Pb paste [37]. The objective was
to develop inhomogeneous microstructures like that in Fig. 16.2b in order to
evaluate the failure behavior of those interconnections. Unfortunately, only one test
vehicle achieved this goal; all of the other assemblies had completely homogeneous
microstructures (Fig. 16.2a), which was anticipated because the PoPoPs were
assembled with the single-pass process that must be sufficiently hot to reflow the
Pb-free, first-level interconnections. The Weibull failure data are plotted in Fig. 16.14
2 The top and middle solder joint signals are passed through the second-level (bottom)
interconnections that are least susceptible to TMF failure.
P. Vianco and M. Neilsen
Fig. 16.14 Weibull failure plot shows the performance of PoPoP solder joints. The assemblies
used SAC305 and SAC105 alloys for the top and middle solder joints, respectively, and mixed
Sn–Pb/SAC305 second-level interconnections. The thermal cycle had these parameters: lower
temperature limit of −55 °C; upper temperature limit of 125 °C; 10 min hold times; and 6–8 °C/min
ramp rates
The characteristic lifetimes were very similar between all three solder joint levels
2 .
The relatively low β values belonging to the middle and bottom solder joints indicated
a wider failure distribution that was caused by outliers. However, unlike the typical
circumstance whereby outliers are early (infant mortality) failures, the outliers in
Fig. 16.13 occurred late in the distribution. A package-level, Weibull distribution
was calculated by combining together the failure data from all three solder joints
levels. The corresponding Weibull parameters were: η = 2400 ± 200 cycles and β
= 5.0 ± 1.2.
The PoPoP test vehicles were also assembled with the mixed solder metallurgy at
the second-level interconnections by the combination of SAC305, bottom package
solder balls and an assembly process using Sn–Pb paste [37]. The objective was
to develop inhomogeneous microstructures like that in Fig. 16.2b in order to
evaluate the failure behavior of those interconnections. Unfortunately, only one test
vehicle achieved this goal; all of the other assemblies had completely homogeneous
microstructures (Fig. 16.2a), which was anticipated because the PoPoPs were
assembled with the single-pass process that must be sufficiently hot to reflow the
Pb-free, first-level interconnections. The Weibull failure data are plotted in Fig. 16.14
2 The top and middle solder joint signals are passed through the second-level (bottom)
interconnections that are least susceptible to TMF failure.