

462
L. Chen et al.
Table 15.5 Material properties of bi-material assembly [17]
Copper
Mold compound
C sat at 85°C/85%RH (μg/mm 3 )
N/A
4.0
Diffusivity pre-factor D o (mm 2 /s)
N/A
5.0
Diffusivity activation energy Q (ev)
N/A
0.4
Initial void volume fraction
N/A
0.05
CTE (ppm/°C)
17
see Table 15.4
Young’s modulus (GPa)
130
see Table 15.4
Poisson’s ratio
0.34
0.3
Coefficient of hygroscopic swelling (mm 3 /μg)
N/A
0.5 × 10 −3
The moisture diffusivity of molding compound is dependent on temperature,
which can be described by the Arrhenius equation:
D = D o e
−
Q
RT
(15.31)
where D o is a pre-factor, and Q is the activation energy (ev). Copper does not absorb
moisture, therefore the diffusivity and saturated moisture concentration are assigned
to very small (e.g. 10
−6 lower) values. The values of D o and Q are shown in
Table 15.5.
The assembly initially experiences preconditioning at 85 °C/85%RH for 196 h,
followed immediately by a reflow process. The time history of the reflow process
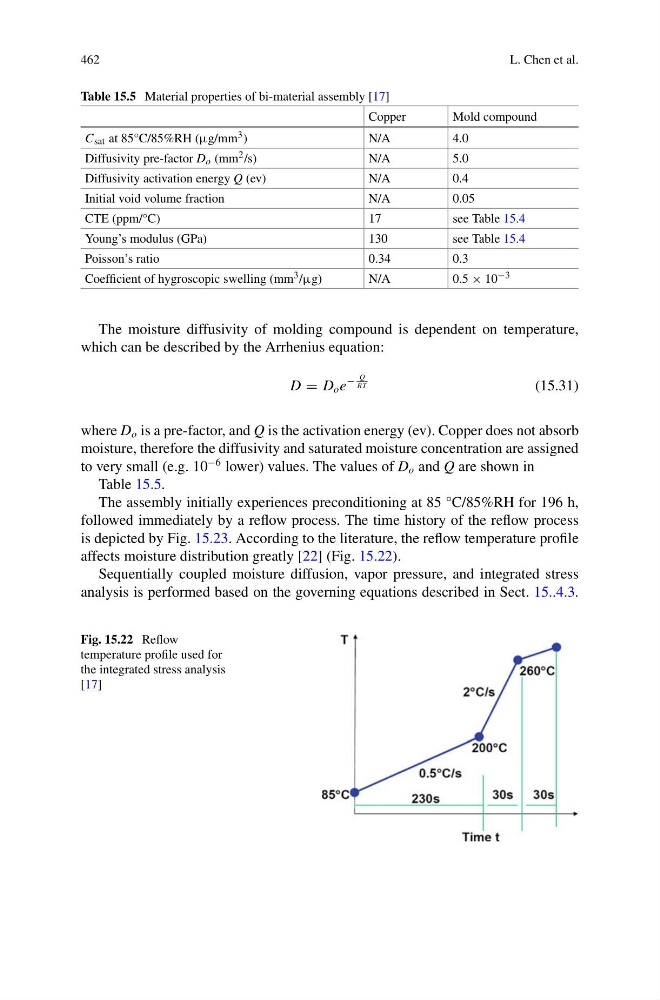
is depicted by Fig. 15.23. According to the literature, the reflow temperature profile
affects moisture distribution greatly [22] (Fig. 15.22).
Sequentially coupled moisture diffusion, vapor pressure, and integrated stress
analysis is performed based on the governing equations described in Sect. 15..4.3.
Fig. 15.22 Reflow
temperature profile used for
the integrated stress analysis
[17]
L. Chen et al.
Table 15.5 Material properties of bi-material assembly [17]
Copper
Mold compound
C sat at 85°C/85%RH (μg/mm 3 )
N/A
4.0
Diffusivity pre-factor D o (mm 2 /s)
N/A
5.0
Diffusivity activation energy Q (ev)
N/A
0.4
Initial void volume fraction
N/A
0.05
CTE (ppm/°C)
17
see Table 15.4
Young’s modulus (GPa)
130
see Table 15.4
Poisson’s ratio
0.34
0.3
Coefficient of hygroscopic swelling (mm 3 /μg)
N/A
0.5 × 10 −3
The moisture diffusivity of molding compound is dependent on temperature,
which can be described by the Arrhenius equation:
D = D o e
−
Q
RT
(15.31)
where D o is a pre-factor, and Q is the activation energy (ev). Copper does not absorb
moisture, therefore the diffusivity and saturated moisture concentration are assigned
to very small (e.g. 10
−6 lower) values. The values of D o and Q are shown in
Table 15.5.
The assembly initially experiences preconditioning at 85 °C/85%RH for 196 h,
followed immediately by a reflow process. The time history of the reflow process
is depicted by Fig. 15.23. According to the literature, the reflow temperature profile
affects moisture distribution greatly [22] (Fig. 15.22).
Sequentially coupled moisture diffusion, vapor pressure, and integrated stress
analysis is performed based on the governing equations described in Sect. 15..4.3.
Fig. 15.22 Reflow
temperature profile used for
the integrated stress analysis
[17]