

15 Die and Package Level Thermal and Thermal/Moisture Stresses …
463
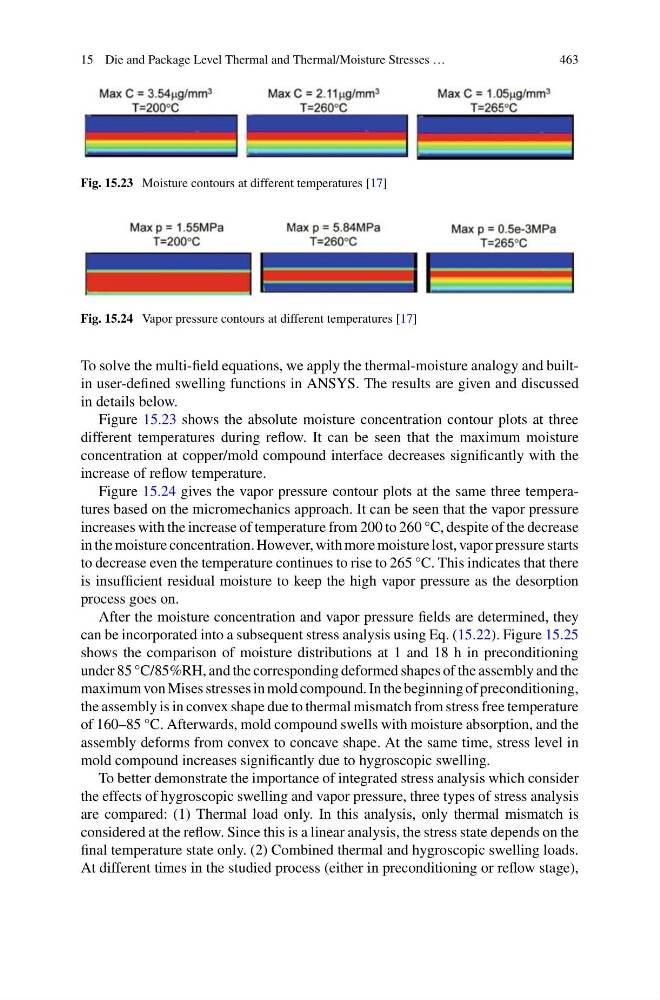
Fig. 15.23 Moisture contours at different temperatures [17]
Fig. 15.24 Vapor pressure contours at different temperatures [17]
To solve the multi-field equations, we apply the thermal-moisture analogy and builtin user-defined swelling functions in ANSYS. The results are given and discussed
in details below.
Figure 15.23 shows the absolute moisture concentration contour plots at three
different temperatures during reflow. It can be seen that the maximum moisture
concentration at copper/mold compound interface decreases significantly with the
increase of reflow temperature.
Figure 15.24 gives the vapor pressure contour plots at the same three temperatures based on the micromechanics approach. It can be seen that the vapor pressure
increases with the increase of temperature from 200 to 260 °C, despite of the decrease
in the moisture concentration. However, with more moisture lost, vapor pressure starts
to decrease even the temperature continues to rise to 265 °C. This indicates that there
is insufficient residual moisture to keep the high vapor pressure as the desorption
process goes on.
After the moisture concentration and vapor pressure fields are determined, they
can be incorporated into a subsequent stress analysis using Eq. (15.22). Figure 15.25
shows the comparison of moisture distributions at 1 and 18 h in preconditioning
under 85 °C/85%RH, and the corresponding deformed shapes of the assembly and the
maximum von Mises stresses in mold compound. In the beginning of preconditioning,
the assembly is in convex shape due to thermal mismatch from stress free temperature
of 160–85 °C. Afterwards, mold compound swells with moisture absorption, and the
assembly deforms from convex to concave shape. At the same time, stress level in
mold compound increases significantly due to hygroscopic swelling.
To better demonstrate the importance of integrated stress analysis which consider
the effects of hygroscopic swelling and vapor pressure, three types of stress analysis
are compared: (1) Thermal load only. In this analysis, only thermal mismatch is
considered at the reflow. Since this is a linear analysis, the stress state depends on the
final temperature state only. (2) Combined thermal and hygroscopic swelling loads.
At different times in the studied process (either in preconditioning or reflow stage),
463
Fig. 15.23 Moisture contours at different temperatures [17]
Fig. 15.24 Vapor pressure contours at different temperatures [17]
To solve the multi-field equations, we apply the thermal-moisture analogy and builtin user-defined swelling functions in ANSYS. The results are given and discussed
in details below.
Figure 15.23 shows the absolute moisture concentration contour plots at three
different temperatures during reflow. It can be seen that the maximum moisture
concentration at copper/mold compound interface decreases significantly with the
increase of reflow temperature.
Figure 15.24 gives the vapor pressure contour plots at the same three temperatures based on the micromechanics approach. It can be seen that the vapor pressure
increases with the increase of temperature from 200 to 260 °C, despite of the decrease
in the moisture concentration. However, with more moisture lost, vapor pressure starts
to decrease even the temperature continues to rise to 265 °C. This indicates that there
is insufficient residual moisture to keep the high vapor pressure as the desorption
process goes on.
After the moisture concentration and vapor pressure fields are determined, they
can be incorporated into a subsequent stress analysis using Eq. (15.22). Figure 15.25
shows the comparison of moisture distributions at 1 and 18 h in preconditioning
under 85 °C/85%RH, and the corresponding deformed shapes of the assembly and the
maximum von Mises stresses in mold compound. In the beginning of preconditioning,
the assembly is in convex shape due to thermal mismatch from stress free temperature
of 160–85 °C. Afterwards, mold compound swells with moisture absorption, and the
assembly deforms from convex to concave shape. At the same time, stress level in
mold compound increases significantly due to hygroscopic swelling.
To better demonstrate the importance of integrated stress analysis which consider
the effects of hygroscopic swelling and vapor pressure, three types of stress analysis
are compared: (1) Thermal load only. In this analysis, only thermal mismatch is
considered at the reflow. Since this is a linear analysis, the stress state depends on the
final temperature state only. (2) Combined thermal and hygroscopic swelling loads.
At different times in the studied process (either in preconditioning or reflow stage),