

10 Fundamentals of Bonding Technology and Process Materials …
279
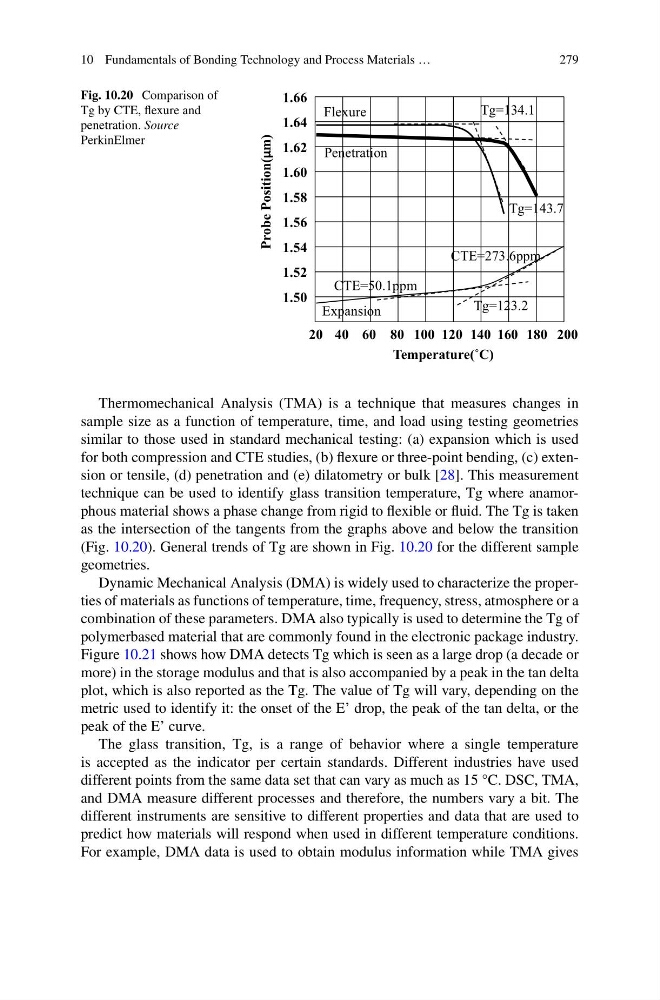
Fig. 10.20 Comparison of
Tg by CTE, flexure and
penetration. Source
PerkinElmer
20
200
0
6
1
0
8
1
0
4
1
0
2
1
0
8
0
0
1
0
6
0
4
Temperature(˚C)
1.50
1.52
1.54
1.56
1.58
1.60
1.62
1.64
1.66
Probe Position(μm)
Tg=134.1
Flexure
Tg=143.7
Tg=123.2
CTE=273.6ppm
CTE=50.1ppm
Penetration
Expansion
Thermomechanical Analysis (TMA) is a technique that measures changes in
sample size as a function of temperature, time, and load using testing geometries
similar to those used in standard mechanical testing: (a) expansion which is used
for both compression and CTE studies, (b) flexure or three-point bending, (c) extension or tensile, (d) penetration and (e) dilatometry or bulk [28]. This measurement
technique can be used to identify glass transition temperature, Tg where anamorphous material shows a phase change from rigid to flexible or fluid. The Tg is taken
as the intersection of the tangents from the graphs above and below the transition
(Fig. 10.20). General trends of Tg are shown in Fig. 10.20 for the different sample
geometries.
Dynamic Mechanical Analysis (DMA) is widely used to characterize the properties of materials as functions of temperature, time, frequency, stress, atmosphere or a
combination of these parameters. DMA also typically is used to determine the Tg of
polymerbased material that are commonly found in the electronic package industry.
Figure 10.21 shows how DMA detects Tg which is seen as a large drop (a decade or
more) in the storage modulus and that is also accompanied by a peak in the tan delta
plot, which is also reported as the Tg. The value of Tg will vary, depending on the
metric used to identify it: the onset of the E’ drop, the peak of the tan delta, or the
peak of the E’ curve.
The glass transition, Tg, is a range of behavior where a single temperature
is accepted as the indicator per certain standards. Different industries have used
different points from the same data set that can vary as much as 15 °C. DSC, TMA,
and DMA measure different processes and therefore, the numbers vary a bit. The
different instruments are sensitive to different properties and data that are used to
predict how materials will respond when used in different temperature conditions.
For example, DMA data is used to obtain modulus information while TMA gives
279
Fig. 10.20 Comparison of
Tg by CTE, flexure and
penetration. Source
PerkinElmer
20
200
0
6
1
0
8
1
0
4
1
0
2
1
0
8
0
0
1
0
6
0
4
Temperature(˚C)
1.50
1.52
1.54
1.56
1.58
1.60
1.62
1.64
1.66
Probe Position(μm)
Tg=134.1
Flexure
Tg=143.7
Tg=123.2
CTE=273.6ppm
CTE=50.1ppm
Penetration
Expansion
Thermomechanical Analysis (TMA) is a technique that measures changes in
sample size as a function of temperature, time, and load using testing geometries
similar to those used in standard mechanical testing: (a) expansion which is used
for both compression and CTE studies, (b) flexure or three-point bending, (c) extension or tensile, (d) penetration and (e) dilatometry or bulk [28]. This measurement
technique can be used to identify glass transition temperature, Tg where anamorphous material shows a phase change from rigid to flexible or fluid. The Tg is taken
as the intersection of the tangents from the graphs above and below the transition
(Fig. 10.20). General trends of Tg are shown in Fig. 10.20 for the different sample
geometries.
Dynamic Mechanical Analysis (DMA) is widely used to characterize the properties of materials as functions of temperature, time, frequency, stress, atmosphere or a
combination of these parameters. DMA also typically is used to determine the Tg of
polymerbased material that are commonly found in the electronic package industry.
Figure 10.21 shows how DMA detects Tg which is seen as a large drop (a decade or
more) in the storage modulus and that is also accompanied by a peak in the tan delta
plot, which is also reported as the Tg. The value of Tg will vary, depending on the
metric used to identify it: the onset of the E’ drop, the peak of the tan delta, or the
peak of the E’ curve.
The glass transition, Tg, is a range of behavior where a single temperature
is accepted as the indicator per certain standards. Different industries have used
different points from the same data set that can vary as much as 15 °C. DSC, TMA,
and DMA measure different processes and therefore, the numbers vary a bit. The
different instruments are sensitive to different properties and data that are used to
predict how materials will respond when used in different temperature conditions.
For example, DMA data is used to obtain modulus information while TMA gives