

10 Fundamentals of Bonding Technology and Process Materials …
277
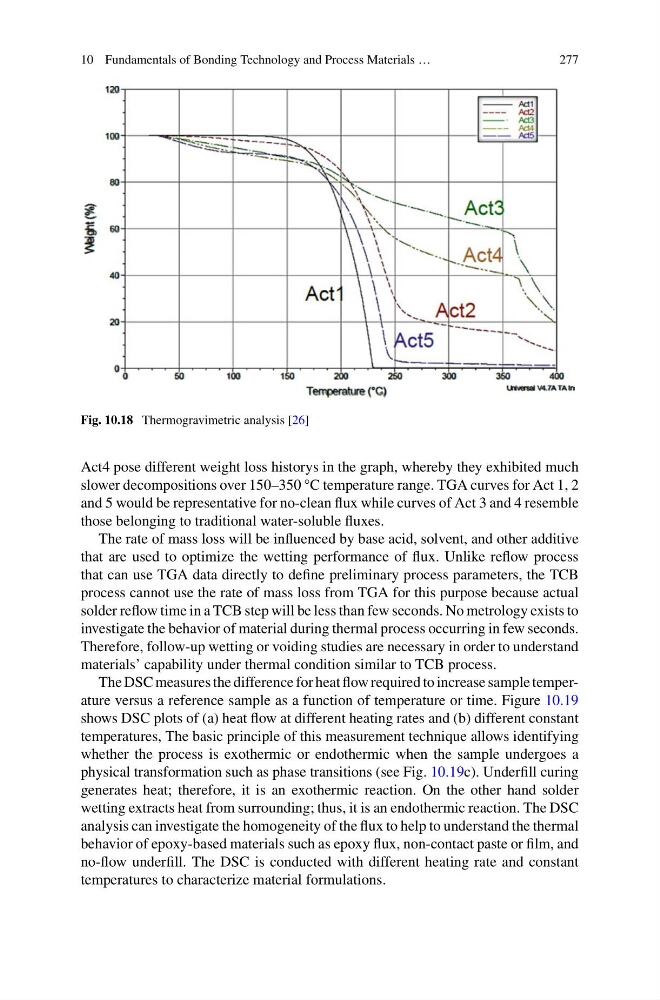
Fig. 10.18 Thermogravimetric analysis [26]
Act4 pose different weight loss historys in the graph, whereby they exhibited much
slower decompositions over 150–350 °C temperature range. TGA curves for Act 1, 2
and 5 would be representative for no-clean flux while curves of Act 3 and 4 resemble
those belonging to traditional water-soluble fluxes.
The rate of mass loss will be influenced by base acid, solvent, and other additive
that are used to optimize the wetting performance of flux. Unlike reflow process
that can use TGA data directly to define preliminary process parameters, the TCB
process cannot use the rate of mass loss from TGA for this purpose because actual
solder reflow time in a TCB step will be less than few seconds. No metrology exists to
investigate the behavior of material during thermal process occurring in few seconds.
Therefore, follow-up wetting or voiding studies are necessary in order to understand
materials’ capability under thermal condition similar to TCB process.
The DSC measures the difference for heat flow required to increase sample temperature versus a reference sample as a function of temperature or time. Figure 10.19
shows DSC plots of (a) heat flow at different heating rates and (b) different constant
temperatures, The basic principle of this measurement technique allows identifying
whether the process is exothermic or endothermic when the sample undergoes a
physical transformation such as phase transitions (see Fig. 10.19c). Underfill curing
generates heat; therefore, it is an exothermic reaction. On the other hand solder
wetting extracts heat from surrounding; thus, it is an endothermic reaction. The DSC
analysis can investigate the homogeneity of the flux to help to understand the thermal
behavior of epoxy-based materials such as epoxy flux, non-contact paste or film, and
no-flow underfill. The DSC is conducted with different heating rate and constant
temperatures to characterize material formulations.
277
Fig. 10.18 Thermogravimetric analysis [26]
Act4 pose different weight loss historys in the graph, whereby they exhibited much
slower decompositions over 150–350 °C temperature range. TGA curves for Act 1, 2
and 5 would be representative for no-clean flux while curves of Act 3 and 4 resemble
those belonging to traditional water-soluble fluxes.
The rate of mass loss will be influenced by base acid, solvent, and other additive
that are used to optimize the wetting performance of flux. Unlike reflow process
that can use TGA data directly to define preliminary process parameters, the TCB
process cannot use the rate of mass loss from TGA for this purpose because actual
solder reflow time in a TCB step will be less than few seconds. No metrology exists to
investigate the behavior of material during thermal process occurring in few seconds.
Therefore, follow-up wetting or voiding studies are necessary in order to understand
materials’ capability under thermal condition similar to TCB process.
The DSC measures the difference for heat flow required to increase sample temperature versus a reference sample as a function of temperature or time. Figure 10.19
shows DSC plots of (a) heat flow at different heating rates and (b) different constant
temperatures, The basic principle of this measurement technique allows identifying
whether the process is exothermic or endothermic when the sample undergoes a
physical transformation such as phase transitions (see Fig. 10.19c). Underfill curing
generates heat; therefore, it is an exothermic reaction. On the other hand solder
wetting extracts heat from surrounding; thus, it is an endothermic reaction. The DSC
analysis can investigate the homogeneity of the flux to help to understand the thermal
behavior of epoxy-based materials such as epoxy flux, non-contact paste or film, and
no-flow underfill. The DSC is conducted with different heating rate and constant
temperatures to characterize material formulations.