

242
Y. Dai and C. S. Tan
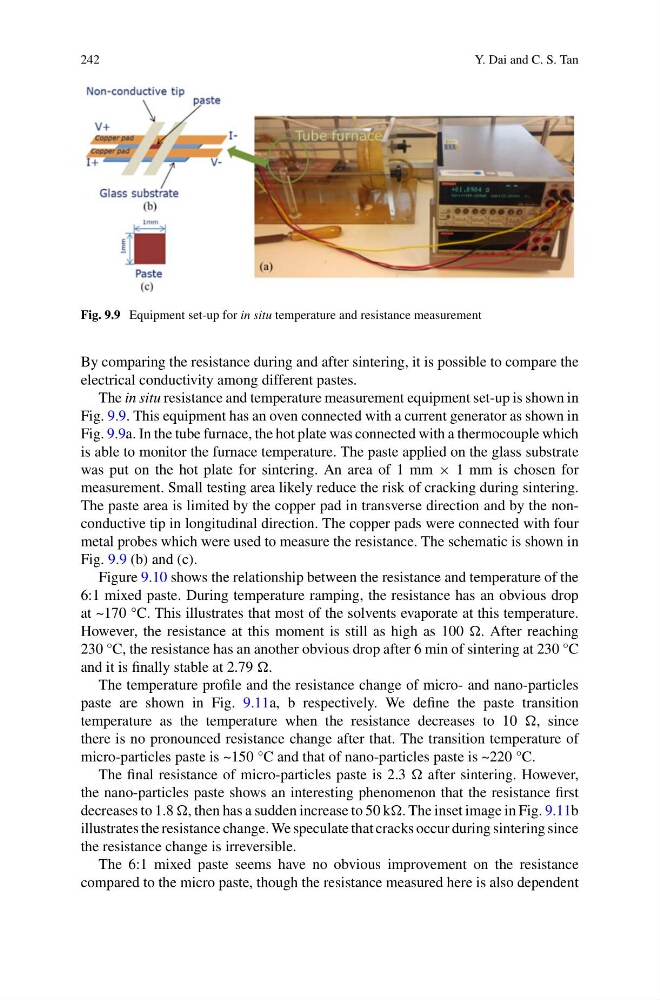
Fig. 9.9 Equipment set-up for in situ temperature and resistance measurement
By comparing the resistance during and after sintering, it is possible to compare the
electrical conductivity among different pastes.
The in situ resistance and temperature measurement equipment set-up is shown in
Fig. 9.9. This equipment has an oven connected with a current generator as shown in
Fig. 9.9a. In the tube furnace, the hot plate was connected with a thermocouple which
is able to monitor the furnace temperature. The paste applied on the glass substrate
was put on the hot plate for sintering. An area of 1 mm × 1 mm is chosen for
measurement. Small testing area likely reduce the risk of cracking during sintering.
The paste area is limited by the copper pad in transverse direction and by the nonconductive tip in longitudinal direction. The copper pads were connected with four
metal probes which were used to measure the resistance. The schematic is shown in
Fig. 9.9 (b) and (c).
Figure 9.10 shows the relationship between the resistance and temperature of the
6:1 mixed paste. During temperature ramping, the resistance has an obvious drop
at ~170 °C. This illustrates that most of the solvents evaporate at this temperature.
However, the resistance at this moment is still as high as 100 . After reaching
230 °C, the resistance has an another obvious drop after 6 min of sintering at 230 °C
and it is finally stable at 2.79 .
The temperature profile and the resistance change of micro- and nano-particles
paste are shown in Fig. 9.11a, b respectively. We define the paste transition
temperature as the temperature when the resistance decreases to 10 , since
there is no pronounced resistance change after that. The transition temperature of
micro-particles paste is ~150 °C and that of nano-particles paste is ~220 °C.
The final resistance of micro-particles paste is 2.3 after sintering. However,
the nano-particles paste shows an interesting phenomenon that the resistance first
decreases to 1.8 , then has a sudden increase to 50 k. The inset image in Fig. 9.11b
illustrates the resistance change. We speculate that cracks occur during sintering since
the resistance change is irreversible.
The 6:1 mixed paste seems have no obvious improvement on the resistance
compared to the micro paste, though the resistance measured here is also dependent
Y. Dai and C. S. Tan
Fig. 9.9 Equipment set-up for in situ temperature and resistance measurement
By comparing the resistance during and after sintering, it is possible to compare the
electrical conductivity among different pastes.
The in situ resistance and temperature measurement equipment set-up is shown in
Fig. 9.9. This equipment has an oven connected with a current generator as shown in
Fig. 9.9a. In the tube furnace, the hot plate was connected with a thermocouple which
is able to monitor the furnace temperature. The paste applied on the glass substrate
was put on the hot plate for sintering. An area of 1 mm × 1 mm is chosen for
measurement. Small testing area likely reduce the risk of cracking during sintering.
The paste area is limited by the copper pad in transverse direction and by the nonconductive tip in longitudinal direction. The copper pads were connected with four
metal probes which were used to measure the resistance. The schematic is shown in
Fig. 9.9 (b) and (c).
Figure 9.10 shows the relationship between the resistance and temperature of the
6:1 mixed paste. During temperature ramping, the resistance has an obvious drop
at ~170 °C. This illustrates that most of the solvents evaporate at this temperature.
However, the resistance at this moment is still as high as 100 . After reaching
230 °C, the resistance has an another obvious drop after 6 min of sintering at 230 °C
and it is finally stable at 2.79 .
The temperature profile and the resistance change of micro- and nano-particles
paste are shown in Fig. 9.11a, b respectively. We define the paste transition
temperature as the temperature when the resistance decreases to 10 , since
there is no pronounced resistance change after that. The transition temperature of
micro-particles paste is ~150 °C and that of nano-particles paste is ~220 °C.
The final resistance of micro-particles paste is 2.3 after sintering. However,
the nano-particles paste shows an interesting phenomenon that the resistance first
decreases to 1.8 , then has a sudden increase to 50 k. The inset image in Fig. 9.11b
illustrates the resistance change. We speculate that cracks occur during sintering since
the resistance change is irreversible.
The 6:1 mixed paste seems have no obvious improvement on the resistance
compared to the micro paste, though the resistance measured here is also dependent