

9 Copper Micro and Nano Particles Mixture for 3D Interconnection …
243
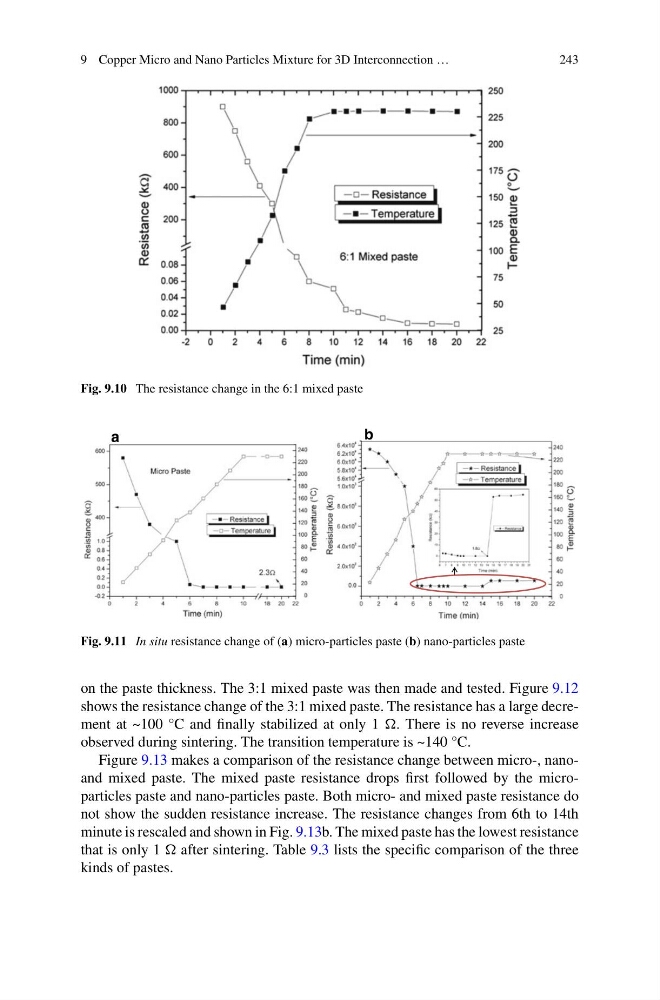
Fig. 9.10 The resistance change in the 6:1 mixed paste
a
b
Fig. 9.11 In situ resistance change of (a) micro-particles paste (b) nano-particles paste
on the paste thickness. The 3:1 mixed paste was then made and tested. Figure 9.12
shows the resistance change of the 3:1 mixed paste. The resistance has a large decrement at ~100 °C and finally stabilized at only 1 There is no reverse increase
observed during sintering. The transition temperature is ~140 °C.
Figure 9.13 makes a comparison of the resistance change between micro-, nanoand mixed paste. The mixed paste resistance drops first followed by the microparticles paste and nano-particles paste. Both micro- and mixed paste resistance do
not show the sudden resistance increase. The resistance changes from 6th to 14th
minute is rescaled and shown in Fig. 9.13b. The mixed paste has the lowest resistance
that is only 1 after sintering. Table 9.3 lists the specific comparison of the three
kinds of pastes.
243
Fig. 9.10 The resistance change in the 6:1 mixed paste
a
b
Fig. 9.11 In situ resistance change of (a) micro-particles paste (b) nano-particles paste
on the paste thickness. The 3:1 mixed paste was then made and tested. Figure 9.12
shows the resistance change of the 3:1 mixed paste. The resistance has a large decrement at ~100 °C and finally stabilized at only 1 There is no reverse increase
observed during sintering. The transition temperature is ~140 °C.
Figure 9.13 makes a comparison of the resistance change between micro-, nanoand mixed paste. The mixed paste resistance drops first followed by the microparticles paste and nano-particles paste. Both micro- and mixed paste resistance do
not show the sudden resistance increase. The resistance changes from 6th to 14th
minute is rescaled and shown in Fig. 9.13b. The mixed paste has the lowest resistance
that is only 1 after sintering. Table 9.3 lists the specific comparison of the three
kinds of pastes.