

6 Atomic Scale Kinetics of TSV Protrusion
145
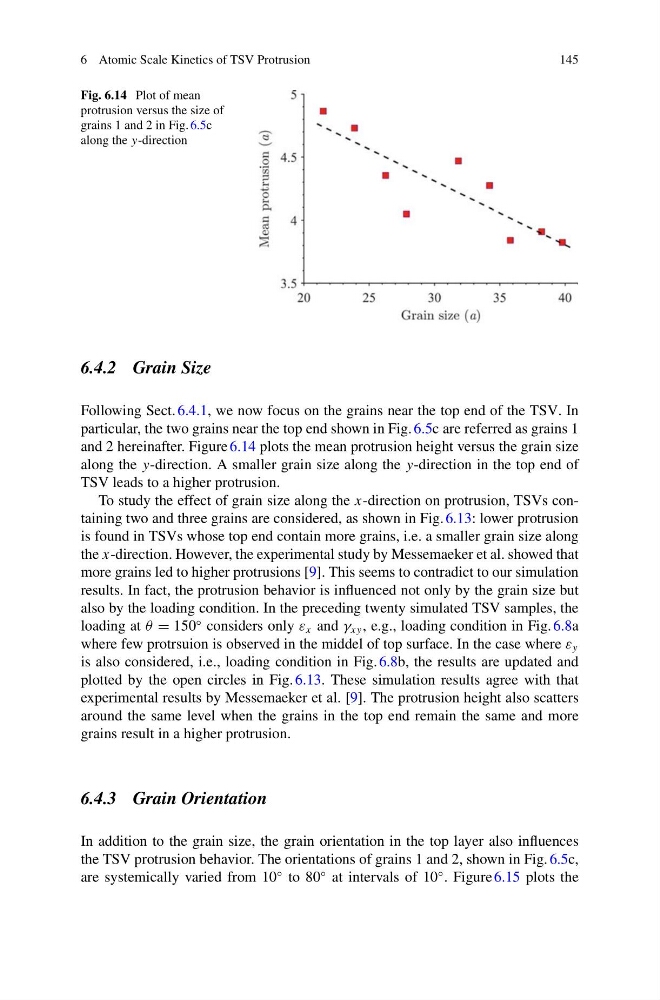
Fig. 6.14 Plot of mean
protrusion versus the size of
grains 1 and 2 in Fig. 6.5c
along the y-direction
6.4.2 Grain Size
Following Sect. 6.4.1, we now focus on the grains near the top end of the TSV. In
particular, the two grains near the top end shown in Fig. 6.5c are referred as grains 1
and 2 hereinafter. Figure 6.14 plots the mean protrusion height versus the grain size
along the y-direction. A smaller grain size along the y-direction in the top end of
TSV leads to a higher protrusion.
To study the effect of grain size along the x-direction on protrusion, TSVs containing two and three grains are considered, as shown in Fig. 6.13: lower protrusion
is found in TSVs whose top end contain more grains, i.e. a smaller grain size along
the x-direction. However, the experimental study by Messemaeker et al. showed that
more grains led to higher protrusions [9]. This seems to contradict to our simulation
results. In fact, the protrusion behavior is influenced not only by the grain size but
also by the loading condition. In the preceding twenty simulated TSV samples, the
loading at θ = 150
◦ considers only ε x and γ xy , e.g., loading condition in Fig. 6.8a
where few protrsuion is observed in the middel of top surface. In the case where ε y
is also considered, i.e., loading condition in Fig. 6.8b, the results are updated and
plotted by the open circles in Fig. 6.13. These simulation results agree with that
experimental results by Messemaeker et al. [9]. The protrusion height also scatters
around the same level when the grains in the top end remain the same and more
grains result in a higher protrusion.
6.4.3 Grain Orientation
In addition to the grain size, the grain orientation in the top layer also influences
the TSV protrusion behavior. The orientations of grains 1 and 2, shown in Fig. 6.5c,
are systemically varied from 10
◦ to 80
◦ at intervals of 10
◦ . Figure 6.15 plots the
145
Fig. 6.14 Plot of mean
protrusion versus the size of
grains 1 and 2 in Fig. 6.5c
along the y-direction
6.4.2 Grain Size
Following Sect. 6.4.1, we now focus on the grains near the top end of the TSV. In
particular, the two grains near the top end shown in Fig. 6.5c are referred as grains 1
and 2 hereinafter. Figure 6.14 plots the mean protrusion height versus the grain size
along the y-direction. A smaller grain size along the y-direction in the top end of
TSV leads to a higher protrusion.
To study the effect of grain size along the x-direction on protrusion, TSVs containing two and three grains are considered, as shown in Fig. 6.13: lower protrusion
is found in TSVs whose top end contain more grains, i.e. a smaller grain size along
the x-direction. However, the experimental study by Messemaeker et al. showed that
more grains led to higher protrusions [9]. This seems to contradict to our simulation
results. In fact, the protrusion behavior is influenced not only by the grain size but
also by the loading condition. In the preceding twenty simulated TSV samples, the
loading at θ = 150
◦ considers only ε x and γ xy , e.g., loading condition in Fig. 6.8a
where few protrsuion is observed in the middel of top surface. In the case where ε y
is also considered, i.e., loading condition in Fig. 6.8b, the results are updated and
plotted by the open circles in Fig. 6.13. These simulation results agree with that
experimental results by Messemaeker et al. [9]. The protrusion height also scatters
around the same level when the grains in the top end remain the same and more
grains result in a higher protrusion.
6.4.3 Grain Orientation
In addition to the grain size, the grain orientation in the top layer also influences
the TSV protrusion behavior. The orientations of grains 1 and 2, shown in Fig. 6.5c,
are systemically varied from 10
◦ to 80
◦ at intervals of 10
◦ . Figure 6.15 plots the