

144
J. Liu et al.
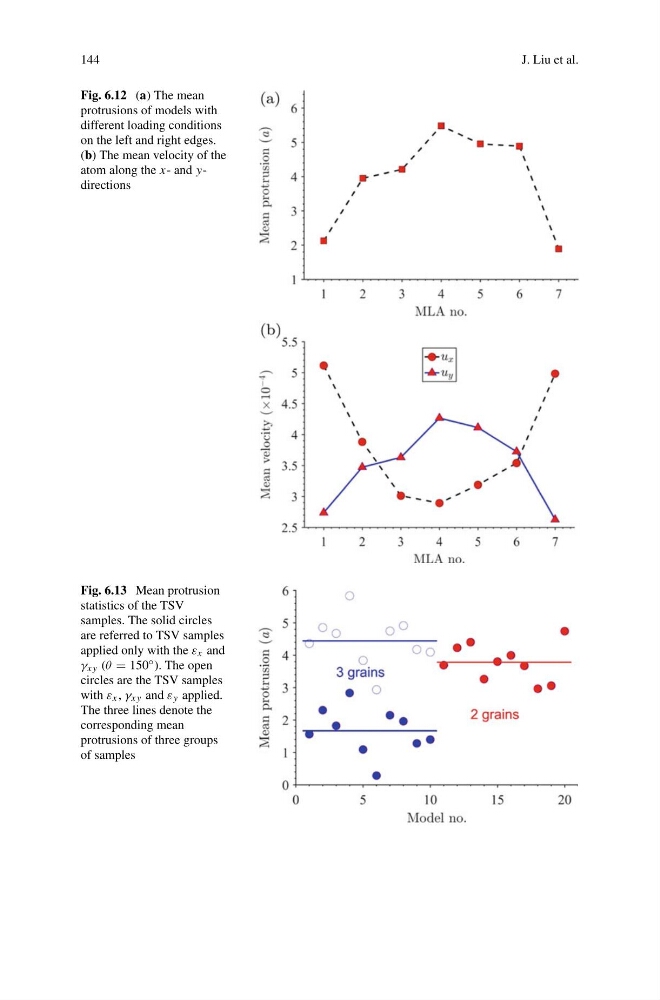
Fig. 6.12 (a) The mean
protrusions of models with
different loading conditions
on the left and right edges.
(b) The mean velocity of the
atom along the x- and ydirections
Fig. 6.13 Mean protrusion
statistics of the TSV
samples. The solid circles
are referred to TSV samples
applied only with the ε x and
γ xy (θ = 150 ◦ ). The open
circles are the TSV samples
with ε x , γ xy and ε y applied.
The three lines denote the
corresponding mean
protrusions of three groups
of samples
J. Liu et al.
Fig. 6.12 (a) The mean
protrusions of models with
different loading conditions
on the left and right edges.
(b) The mean velocity of the
atom along the x- and ydirections
Fig. 6.13 Mean protrusion
statistics of the TSV
samples. The solid circles
are referred to TSV samples
applied only with the ε x and
γ xy (θ = 150 ◦ ). The open
circles are the TSV samples
with ε x , γ xy and ε y applied.
The three lines denote the
corresponding mean
protrusions of three groups
of samples