

114
J. Liu et al.
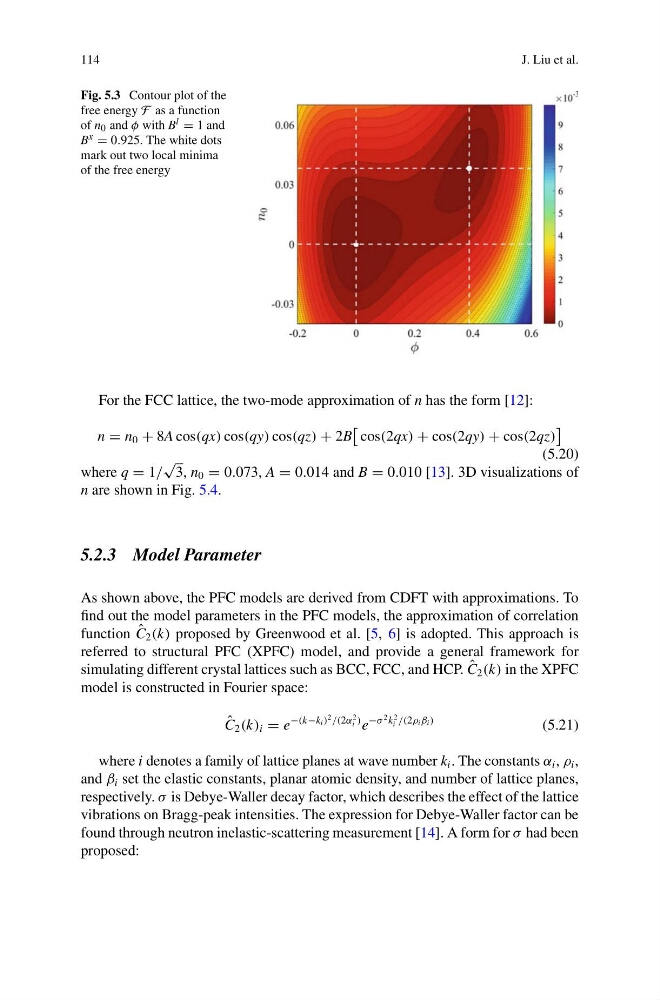
Fig. 5.3 Contour plot of the
free energy F as a function
of n 0 and φ with B l = 1 and
B x = 0.925. The white dots
mark out two local minima
of the free energy
For the FCC lattice, the two-mode approximation of n has the form [12]:
n = n 0 + 8A cos(qx) cos(qy) cos(qz) + 2B
cos(2qx) + cos(2qy) + cos(2qz)
(5.20)
where q = 1/
√
3, n 0 = 0.073, A = 0.014 and B = 0.010 [13]. 3D visualizations of
n are shown in Fig. 5.4.
5.2.3 Model Parameter
As shown above, the PFC models are derived from CDFT with approximations. To
find out the model parameters in the PFC models, the approximation of correlation
function ˆ
C 2 (k) proposed by Greenwood et al. [5, 6] is adopted. This approach is
referred to structural PFC (XPFC) model, and provide a general framework for
simulating different crystal lattices such as BCC, FCC, and HCP. ˆ
C 2 (k) in the XPFC
model is constructed in Fourier space:
ˆ
C 2 (k) i = e
−(k−k i )
2 /(2α
2
i ) e
−σ
2 k
2
i /(2ρ i β i )
(5.21)
where i denotes a family of lattice planes at wave number k i . The constants α i , ρ i ,
and β i set the elastic constants, planar atomic density, and number of lattice planes,
respectively. σ is Debye-Waller decay factor, which describes the effect of the lattice
vibrations on Bragg-peak intensities. The expression for Debye-Waller factor can be
found through neutron inelastic-scattering measurement [14]. A form for σ had been
proposed:
J. Liu et al.
Fig. 5.3 Contour plot of the
free energy F as a function
of n 0 and φ with B l = 1 and
B x = 0.925. The white dots
mark out two local minima
of the free energy
For the FCC lattice, the two-mode approximation of n has the form [12]:
n = n 0 + 8A cos(qx) cos(qy) cos(qz) + 2B
cos(2qx) + cos(2qy) + cos(2qz)
(5.20)
where q = 1/
√
3, n 0 = 0.073, A = 0.014 and B = 0.010 [13]. 3D visualizations of
n are shown in Fig. 5.4.
5.2.3 Model Parameter
As shown above, the PFC models are derived from CDFT with approximations. To
find out the model parameters in the PFC models, the approximation of correlation
function ˆ
C 2 (k) proposed by Greenwood et al. [5, 6] is adopted. This approach is
referred to structural PFC (XPFC) model, and provide a general framework for
simulating different crystal lattices such as BCC, FCC, and HCP. ˆ
C 2 (k) in the XPFC
model is constructed in Fourier space:
ˆ
C 2 (k) i = e
−(k−k i )
2 /(2α
2
i ) e
−σ
2 k
2
i /(2ρ i β i )
(5.21)
where i denotes a family of lattice planes at wave number k i . The constants α i , ρ i ,
and β i set the elastic constants, planar atomic density, and number of lattice planes,
respectively. σ is Debye-Waller decay factor, which describes the effect of the lattice
vibrations on Bragg-peak intensities. The expression for Debye-Waller factor can be
found through neutron inelastic-scattering measurement [14]. A form for σ had been
proposed: