

5 Phase-Field-Crystal Model: A Tool for Probing Atoms in TSV
115
(a)
(b)
(c)
(d)
(e)
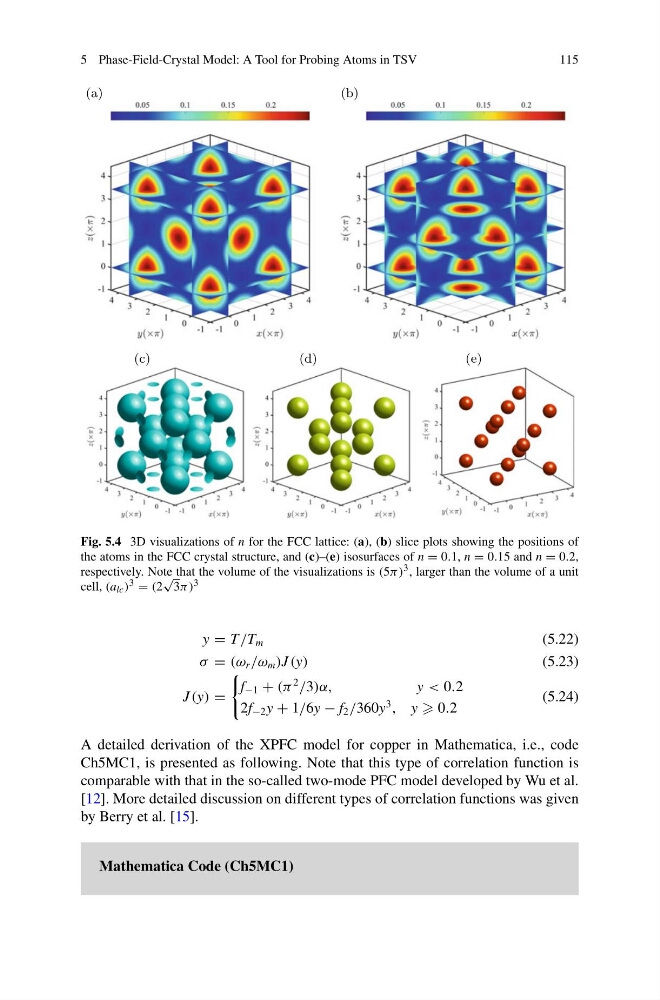
Fig. 5.4 3D visualizations of n for the FCC lattice: (a), (b) slice plots showing the positions of
the atoms in the FCC crystal structure, and (c)–(e) isosurfaces of n = 0.1, n = 0.15 and n = 0.2,
respectively. Note that the volume of the visualizations is (5π) 3 , larger than the volume of a unit
cell, (a lc ) 3 = (2
√
3π) 3
y = T /T m
(5.22)
σ = (ω r /ω m )J (y)
(5.23)
J (y) =
f −1 + (π
2
/3)α,
y < 0.2
2f −2 y + 1/6y − f 2 /360y
3
, y 0.2
(5.24)
A detailed derivation of the XPFC model for copper in Mathematica, i.e., code
Ch5MC1, is presented as following. Note that this type of correlation function is
comparable with that in the so-called two-mode PFC model developed by Wu et al.
[12]. More detailed discussion on different types of correlation functions was given
by Berry et al. [15].
Mathematica Code (Ch5MC1)
115
(a)
(b)
(c)
(d)
(e)
Fig. 5.4 3D visualizations of n for the FCC lattice: (a), (b) slice plots showing the positions of
the atoms in the FCC crystal structure, and (c)–(e) isosurfaces of n = 0.1, n = 0.15 and n = 0.2,
respectively. Note that the volume of the visualizations is (5π) 3 , larger than the volume of a unit
cell, (a lc ) 3 = (2
√
3π) 3
y = T /T m
(5.22)
σ = (ω r /ω m )J (y)
(5.23)
J (y) =
f −1 + (π
2
/3)α,
y < 0.2
2f −2 y + 1/6y − f 2 /360y
3
, y 0.2
(5.24)
A detailed derivation of the XPFC model for copper in Mathematica, i.e., code
Ch5MC1, is presented as following. Note that this type of correlation function is
comparable with that in the so-called two-mode PFC model developed by Wu et al.
[12]. More detailed discussion on different types of correlation functions was given
by Berry et al. [15].
Mathematica Code (Ch5MC1)