

110
J. Liu et al.
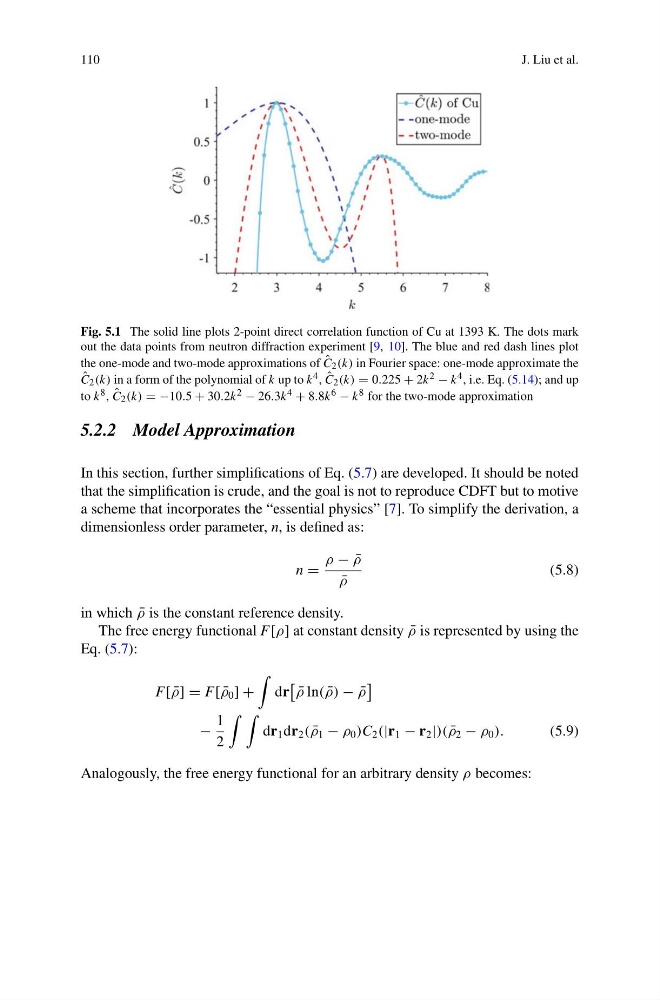
Fig. 5.1 The solid line plots 2-point direct correlation function of Cu at 1393 K. The dots mark
out the data points from neutron diffraction experiment [9, 10]. The blue and red dash lines plot
the one-mode and two-mode approximations of ˆ
C 2 (k) in Fourier space: one-mode approximate the
ˆ
C 2 (k) in a form of the polynomial of k up to k 4 , ˆ
C 2 (k) = 0.225 + 2k 2 − k 4 , i.e. Eq. (5.14); and up
to k 8 , ˆ
C 2 (k) = −10.5 + 30.2k 2 − 26.3k 4 + 8.8k 6 − k 8 for the two-mode approximation
5.2.2 Model Approximation
In this section, further simplifications of Eq. (5.7) are developed. It should be noted
that the simplification is crude, and the goal is not to reproduce CDFT but to motive
a scheme that incorporates the “essential physics” [7]. To simplify the derivation, a
dimensionless order parameter, n, is defined as:
n =
ρ − ¯
ρ
¯
ρ
(5.8)
in which ¯
ρ is the constant reference density.
The free energy functional F[ρ] at constant density ¯
ρ is represented by using the
Eq. (5.7):
F[ ¯
ρ] = F[ ¯
ρ 0 ] +
dr
¯
ρ ln( ¯
ρ) − ¯
ρ
−
1
2
dr 1 dr 2 ( ¯
ρ 1 − ρ 0 )C 2 (|r 1 − r 2 |)( ¯
ρ 2 − ρ 0 ).
(5.9)
Analogously, the free energy functional for an arbitrary density ρ becomes:
J. Liu et al.
Fig. 5.1 The solid line plots 2-point direct correlation function of Cu at 1393 K. The dots mark
out the data points from neutron diffraction experiment [9, 10]. The blue and red dash lines plot
the one-mode and two-mode approximations of ˆ
C 2 (k) in Fourier space: one-mode approximate the
ˆ
C 2 (k) in a form of the polynomial of k up to k 4 , ˆ
C 2 (k) = 0.225 + 2k 2 − k 4 , i.e. Eq. (5.14); and up
to k 8 , ˆ
C 2 (k) = −10.5 + 30.2k 2 − 26.3k 4 + 8.8k 6 − k 8 for the two-mode approximation
5.2.2 Model Approximation
In this section, further simplifications of Eq. (5.7) are developed. It should be noted
that the simplification is crude, and the goal is not to reproduce CDFT but to motive
a scheme that incorporates the “essential physics” [7]. To simplify the derivation, a
dimensionless order parameter, n, is defined as:
n =
ρ − ¯
ρ
¯
ρ
(5.8)
in which ¯
ρ is the constant reference density.
The free energy functional F[ρ] at constant density ¯
ρ is represented by using the
Eq. (5.7):
F[ ¯
ρ] = F[ ¯
ρ 0 ] +
dr
¯
ρ ln( ¯
ρ) − ¯
ρ
−
1
2
dr 1 dr 2 ( ¯
ρ 1 − ρ 0 )C 2 (|r 1 − r 2 |)( ¯
ρ 2 − ρ 0 ).
(5.9)
Analogously, the free energy functional for an arbitrary density ρ becomes: