

5 Phase-Field-Crystal Model: A Tool for Probing Atoms in TSV
111
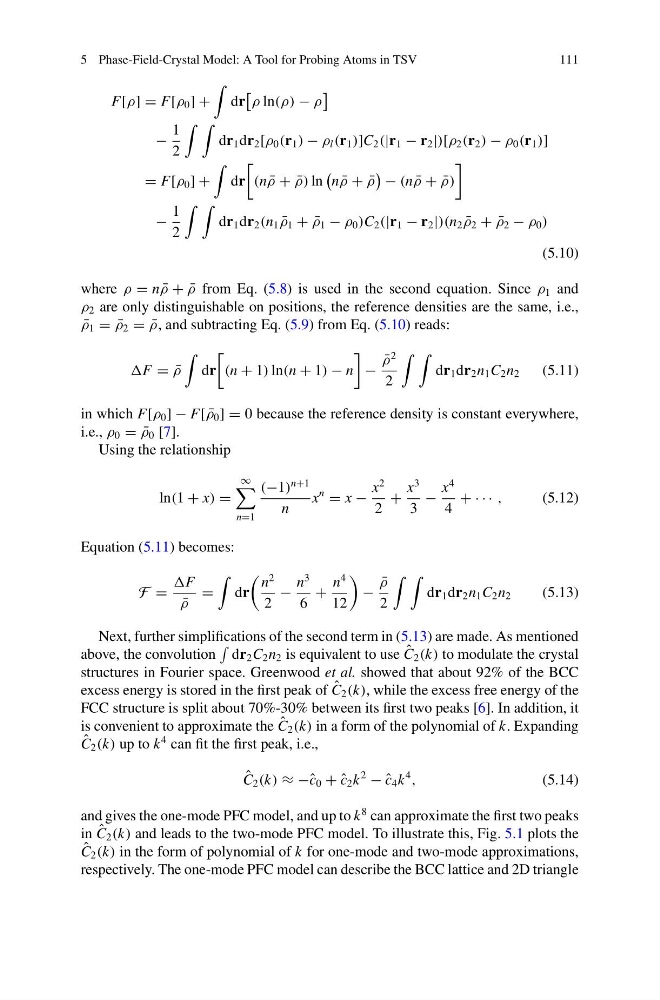
F[ρ] = F[ρ 0 ] +
dr
ρ ln(ρ) − ρ
−
1
2
dr 1 dr 2 [ρ 0 (r 1 ) − ρ l (r 1 )]C 2 (|r 1 − r 2 |)[ρ 2 (r 2 ) − ρ 0 (r 1 )]
= F[ρ 0 ] +
dr
(n ¯
ρ + ¯
ρ) ln
n ¯
ρ + ¯
ρ
− (n ¯
ρ + ¯
ρ)
−
1
2
dr 1 dr 2 (n 1 ¯
ρ 1 + ¯
ρ 1 − ρ 0 )C 2 (|r 1 − r 2 |)(n 2 ¯
ρ 2 + ¯
ρ 2 − ρ 0 )
(5.10)
where ρ = n ¯
ρ + ¯
ρ from Eq. (5.8) is used in the second equation. Since ρ 1 and
ρ 2 are only distinguishable on positions, the reference densities are the same, i.e.,
¯
ρ 1 = ¯
ρ 2 = ¯
ρ, and subtracting Eq. (5.9) from Eq. (5.10) reads:
F = ¯
ρ
dr
(n + 1) ln(n + 1) − n
−
¯
ρ
2
2
dr 1 dr 2 n 1 C 2 n 2
(5.11)
in which F[ρ 0 ] − F[ ¯
ρ 0 ] = 0 because the reference density is constant everywhere,
i.e., ρ 0 = ¯
ρ 0 [7].
Using the relationship
ln(1 + x) =
∞
n=1
(−1)
n+1
n
x
n
= x −
x
2
2
+
x
3
3
−
x
4
4
+ · · · ,
(5.12)
Equation (5.11) becomes:
F =
F
¯
ρ
=
dr
n
2
2
−
n
3
6
+
n
4
12
−
¯
ρ
2
dr 1 dr 2 n 1 C 2 n 2
(5.13)
Next, further simplifications of the second term in (5.13) are made. As mentioned
above, the convolution
dr 2 C 2 n 2 is equivalent to use ˆ
C 2 (k) to modulate the crystal
structures in Fourier space. Greenwood et al. showed that about 92% of the BCC
excess energy is stored in the first peak of ˆ
C 2 (k), while the excess free energy of the
FCC structure is split about 70%-30% between its first two peaks [6]. In addition, it
is convenient to approximate the ˆ
C 2 (k) in a form of the polynomial of k. Expanding
ˆ
C 2 (k) up to k
4 can fit the first peak, i.e.,
ˆ
C 2 (k) ≈ −ˆ c 0 + ˆ
c 2 k
2
− ˆ
c 4 k
4
,
(5.14)
and gives the one-mode PFC model, and up to k
8 can approximate the first two peaks
in ˆ
C 2 (k) and leads to the two-mode PFC model. To illustrate this, Fig. 5.1 plots the
ˆ
C 2 (k) in the form of polynomial of k for one-mode and two-mode approximations,
respectively. The one-mode PFC model can describe the BCC lattice and 2D triangle
111
F[ρ] = F[ρ 0 ] +
dr
ρ ln(ρ) − ρ
−
1
2
dr 1 dr 2 [ρ 0 (r 1 ) − ρ l (r 1 )]C 2 (|r 1 − r 2 |)[ρ 2 (r 2 ) − ρ 0 (r 1 )]
= F[ρ 0 ] +
dr
(n ¯
ρ + ¯
ρ) ln
n ¯
ρ + ¯
ρ
− (n ¯
ρ + ¯
ρ)
−
1
2
dr 1 dr 2 (n 1 ¯
ρ 1 + ¯
ρ 1 − ρ 0 )C 2 (|r 1 − r 2 |)(n 2 ¯
ρ 2 + ¯
ρ 2 − ρ 0 )
(5.10)
where ρ = n ¯
ρ + ¯
ρ from Eq. (5.8) is used in the second equation. Since ρ 1 and
ρ 2 are only distinguishable on positions, the reference densities are the same, i.e.,
¯
ρ 1 = ¯
ρ 2 = ¯
ρ, and subtracting Eq. (5.9) from Eq. (5.10) reads:
F = ¯
ρ
dr
(n + 1) ln(n + 1) − n
−
¯
ρ
2
2
dr 1 dr 2 n 1 C 2 n 2
(5.11)
in which F[ρ 0 ] − F[ ¯
ρ 0 ] = 0 because the reference density is constant everywhere,
i.e., ρ 0 = ¯
ρ 0 [7].
Using the relationship
ln(1 + x) =
∞
n=1
(−1)
n+1
n
x
n
= x −
x
2
2
+
x
3
3
−
x
4
4
+ · · · ,
(5.12)
Equation (5.11) becomes:
F =
F
¯
ρ
=
dr
n
2
2
−
n
3
6
+
n
4
12
−
¯
ρ
2
dr 1 dr 2 n 1 C 2 n 2
(5.13)
Next, further simplifications of the second term in (5.13) are made. As mentioned
above, the convolution
dr 2 C 2 n 2 is equivalent to use ˆ
C 2 (k) to modulate the crystal
structures in Fourier space. Greenwood et al. showed that about 92% of the BCC
excess energy is stored in the first peak of ˆ
C 2 (k), while the excess free energy of the
FCC structure is split about 70%-30% between its first two peaks [6]. In addition, it
is convenient to approximate the ˆ
C 2 (k) in a form of the polynomial of k. Expanding
ˆ
C 2 (k) up to k
4 can fit the first peak, i.e.,
ˆ
C 2 (k) ≈ −ˆ c 0 + ˆ
c 2 k
2
− ˆ
c 4 k
4
,
(5.14)
and gives the one-mode PFC model, and up to k
8 can approximate the first two peaks
in ˆ
C 2 (k) and leads to the two-mode PFC model. To illustrate this, Fig. 5.1 plots the
ˆ
C 2 (k) in the form of polynomial of k for one-mode and two-mode approximations,
respectively. The one-mode PFC model can describe the BCC lattice and 2D triangle