

171
Production inventory data of energy and GHGE per unit of fertilizer chemicals
refer to 1 kg N in urea ammonium nitrate with an N-content of 32%; 1 kg P 2 O 5 in
ammonium nitrate phosphate with a N-content of 8.4% and a P 2 O 5 -content of 52%;
and 1 kg K 2 O in potassium chloride with a K 2 O-content of 60%. These data take
into account production activities including transport of raw materials and intermediate products but do not account for waste treatment of catalysts, coating, and
packaging. Similarly, energy and emission factors of herbicides are accounted for
during their life cycle during production. Energy consumption and GHGE of
machines were calculated based on 44.8 MJ L
−1
of diesel (Ecoinvent 2017)
accounted for production, transportation, and combustion in machinery. In addition
to that, this value was added with 15 MJ L
−1
for machine production (Bowers 1992;
Dalgaard et al. 2001).
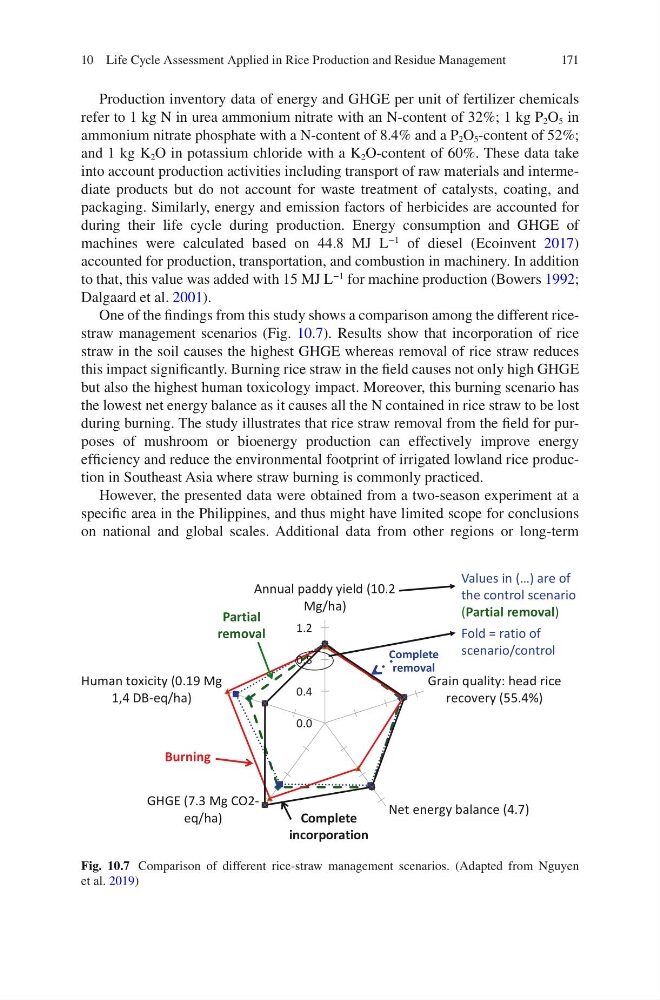
One of the findings from this study shows a comparison among the different ricestraw management scenarios (Fig. 10.7). Results show that incorporation of rice
straw in the soil causes the highest GHGE whereas removal of rice straw reduces
this impact significantly. Burning rice straw in the field causes not only high GHGE
but also the highest human toxicology impact. Moreover, this burning scenario has
the lowest net energy balance as it causes all the N contained in rice straw to be lost
during burning. The study illustrates that rice straw removal from the field for purposes of mushroom or bioenergy production can effectively improve energy
efficiency and reduce the environmental footprint of irrigated lowland rice production in Southeast Asia where straw burning is commonly practiced.
However, the presented data were obtained from a two-season experiment at a
specific area in the Philippines, and thus might have limited scope for conclusions
on national and global scales. Additional data from other regions or long-term
0.0
0.4
0.8
1.2
Annual paddy yield (10.2
Mg/ha)
Grain quality: head rice
recovery (55.4%)
Net energy balance (4.7)
GHGE (7.3 Mg CO2eq/ha)
Human toxicity (0.19 Mg
1,4 DB-eq/ha)
Burning
Partial
removal
Complete
removal
Complete
incorporation
Values in (…) are of
the control scenario
(Partial removal)
Fold = ratio of
scenario/control
Fig. 10.7 Comparison of different rice-straw management scenarios. (Adapted from Nguyen
et al. 2019)
10 Life Cycle Assessment Applied in Rice Production and Residue Management
Production inventory data of energy and GHGE per unit of fertilizer chemicals
refer to 1 kg N in urea ammonium nitrate with an N-content of 32%; 1 kg P 2 O 5 in
ammonium nitrate phosphate with a N-content of 8.4% and a P 2 O 5 -content of 52%;
and 1 kg K 2 O in potassium chloride with a K 2 O-content of 60%. These data take
into account production activities including transport of raw materials and intermediate products but do not account for waste treatment of catalysts, coating, and
packaging. Similarly, energy and emission factors of herbicides are accounted for
during their life cycle during production. Energy consumption and GHGE of
machines were calculated based on 44.8 MJ L
−1
of diesel (Ecoinvent 2017)
accounted for production, transportation, and combustion in machinery. In addition
to that, this value was added with 15 MJ L
−1
for machine production (Bowers 1992;
Dalgaard et al. 2001).
One of the findings from this study shows a comparison among the different ricestraw management scenarios (Fig. 10.7). Results show that incorporation of rice
straw in the soil causes the highest GHGE whereas removal of rice straw reduces
this impact significantly. Burning rice straw in the field causes not only high GHGE
but also the highest human toxicology impact. Moreover, this burning scenario has
the lowest net energy balance as it causes all the N contained in rice straw to be lost
during burning. The study illustrates that rice straw removal from the field for purposes of mushroom or bioenergy production can effectively improve energy
efficiency and reduce the environmental footprint of irrigated lowland rice production in Southeast Asia where straw burning is commonly practiced.
However, the presented data were obtained from a two-season experiment at a
specific area in the Philippines, and thus might have limited scope for conclusions
on national and global scales. Additional data from other regions or long-term
0.0
0.4
0.8
1.2
Annual paddy yield (10.2
Mg/ha)
Grain quality: head rice
recovery (55.4%)
Net energy balance (4.7)
GHGE (7.3 Mg CO2eq/ha)
Human toxicity (0.19 Mg
1,4 DB-eq/ha)
Burning
Partial
removal
Complete
removal
Complete
incorporation
Values in (…) are of
the control scenario
(Partial removal)
Fold = ratio of
scenario/control
Fig. 10.7 Comparison of different rice-straw management scenarios. (Adapted from Nguyen
et al. 2019)
10 Life Cycle Assessment Applied in Rice Production and Residue Management