

of the PSH indoor temperature. In this case, considering a minimum service level of
18
C instead of the PSH indoor temperature, the avoided emission are slightly
lower with 0.344 tCO 2 e, but still significant with an increase of the emission
reduction by 94 % as describe in Table 10.6.
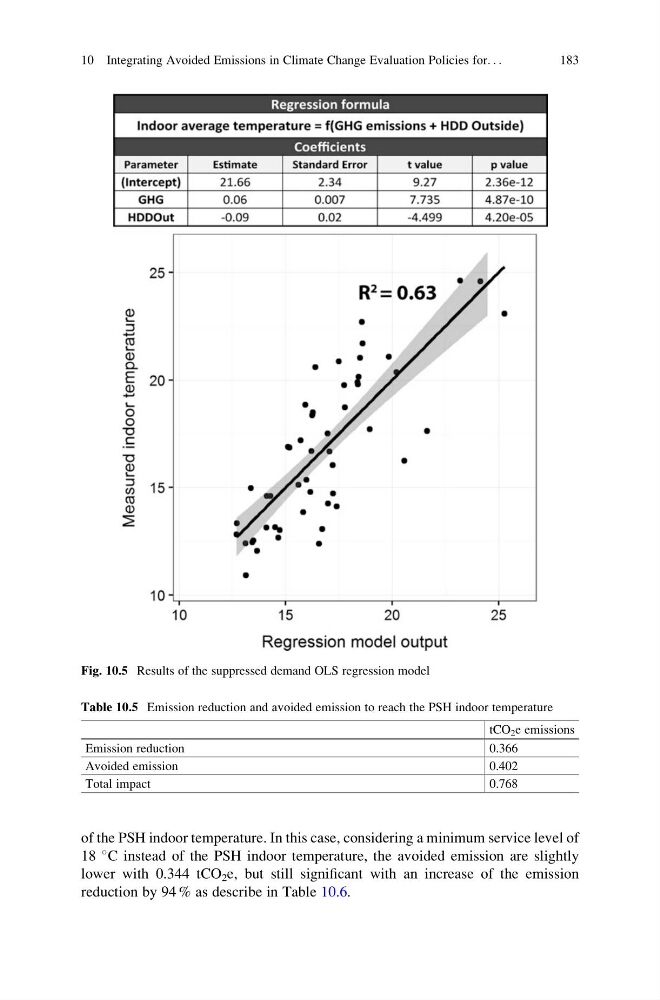
Fig. 10.5 Results of the suppressed demand OLS regression model
Table 10.5 Emission reduction and avoided emission to reach the PSH indoor temperature
tCO 2 e emissions
Emission reduction
0.366
Avoided emission
0.402
Total impact
0.768
10 Integrating Avoided Emissions in Climate Change Evaluation Policies for. . .
183
18
C instead of the PSH indoor temperature, the avoided emission are slightly
lower with 0.344 tCO 2 e, but still significant with an increase of the emission
reduction by 94 % as describe in Table 10.6.
Fig. 10.5 Results of the suppressed demand OLS regression model
Table 10.5 Emission reduction and avoided emission to reach the PSH indoor temperature
tCO 2 e emissions
Emission reduction
0.366
Avoided emission
0.402
Total impact
0.768
10 Integrating Avoided Emissions in Climate Change Evaluation Policies for. . .
183