

129
Knowledge and cognitive type solutions are preferred in Southeast Asia at a rate
of 2.5 times that of East Asia. In Southeast Asia, knowledge and cognitive type solutions make up 23% of the proportion of solutions (Fig. 7.1c), compared with just
14% in South Asia and 9% in East Asia (Fig. 7.1a, b). In Southeast Asia, local communities in SEPLS invest more often in all sub-types of knowledge and cognitive
type solutions at nearly double the rate of the other sub-regions. These include
capacity building (knowledge capacities), monitoring and evaluation systems
(knowledge systems), and bridging knowledge forms from communities and science (knowledge integration). For instance in the Philippines, local ecological
knowledge of ethnic groups is included in practical learning experiences in farmer
field schools, and helps bridge local knowledge systems with new technical developments (Dang 2015). The exception is for assessments and research (knowledge
gaps), which are selected in a slightly higher proportion in East Asia.
In South Asia, economic and incentive-based solutions are preferred more often
than in Southeast Asia, 25% compared with 14%, respectively (Fig. 7.1b, c). While
the proportion of economic-based solutions are similar in East Asia (23%) to South
Asia, the distribution of solution sub-types is different among the two sub-regions.
In South Asia, there is a clear preference for livelihood-based solutions that include
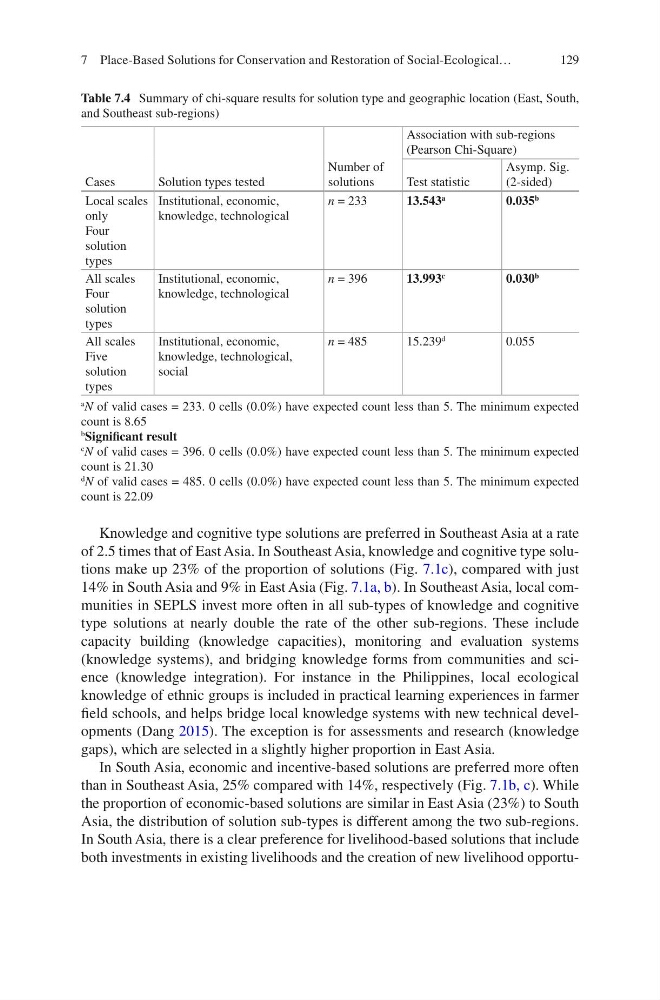
both investments in existing livelihoods and the creation of new livelihood opportuTable 7.4 Summary of chi-square results for solution type and geographic location (East, South,
and Southeast sub-regions)
Cases
Solution types tested
Number of
solutions
Association with sub-regions
(Pearson Chi-Square)
Test statistic
Asymp. Sig.
(2-sided)
Local scales
only
Four
solution
types
Institutional, economic,
knowledge, technological
n = 233
13.543
a
0.035
b
All scales
Four
solution
types
Institutional, economic,
knowledge, technological
n = 396
13.993
c
0.030
b
All scales
Five
solution
types
Institutional, economic,
knowledge, technological,
social
n = 485
15.239
d
0.055
a
N of valid cases = 233. 0 cells (0.0%) have expected count less than 5. The minimum expected
count is 8.65
b
Significant result
c
N of valid cases = 396. 0 cells (0.0%) have expected count less than 5. The minimum expected
count is 21.30
d
N of valid cases = 485. 0 cells (0.0%) have expected count less than 5. The minimum expected
count is 22.09
7 Place-Based Solutions for Conservation and Restoration of Social-Ecological…
Knowledge and cognitive type solutions are preferred in Southeast Asia at a rate
of 2.5 times that of East Asia. In Southeast Asia, knowledge and cognitive type solutions make up 23% of the proportion of solutions (Fig. 7.1c), compared with just
14% in South Asia and 9% in East Asia (Fig. 7.1a, b). In Southeast Asia, local communities in SEPLS invest more often in all sub-types of knowledge and cognitive
type solutions at nearly double the rate of the other sub-regions. These include
capacity building (knowledge capacities), monitoring and evaluation systems
(knowledge systems), and bridging knowledge forms from communities and science (knowledge integration). For instance in the Philippines, local ecological
knowledge of ethnic groups is included in practical learning experiences in farmer
field schools, and helps bridge local knowledge systems with new technical developments (Dang 2015). The exception is for assessments and research (knowledge
gaps), which are selected in a slightly higher proportion in East Asia.
In South Asia, economic and incentive-based solutions are preferred more often
than in Southeast Asia, 25% compared with 14%, respectively (Fig. 7.1b, c). While
the proportion of economic-based solutions are similar in East Asia (23%) to South
Asia, the distribution of solution sub-types is different among the two sub-regions.
In South Asia, there is a clear preference for livelihood-based solutions that include
both investments in existing livelihoods and the creation of new livelihood opportuTable 7.4 Summary of chi-square results for solution type and geographic location (East, South,
and Southeast sub-regions)
Cases
Solution types tested
Number of
solutions
Association with sub-regions
(Pearson Chi-Square)
Test statistic
Asymp. Sig.
(2-sided)
Local scales
only
Four
solution
types
Institutional, economic,
knowledge, technological
n = 233
13.543
a
0.035
b
All scales
Four
solution
types
Institutional, economic,
knowledge, technological
n = 396
13.993
c
0.030
b
All scales
Five
solution
types
Institutional, economic,
knowledge, technological,
social
n = 485
15.239
d
0.055
a
N of valid cases = 233. 0 cells (0.0%) have expected count less than 5. The minimum expected
count is 8.65
b
Significant result
c
N of valid cases = 396. 0 cells (0.0%) have expected count less than 5. The minimum expected
count is 21.30
d
N of valid cases = 485. 0 cells (0.0%) have expected count less than 5. The minimum expected
count is 22.09
7 Place-Based Solutions for Conservation and Restoration of Social-Ecological…