

127
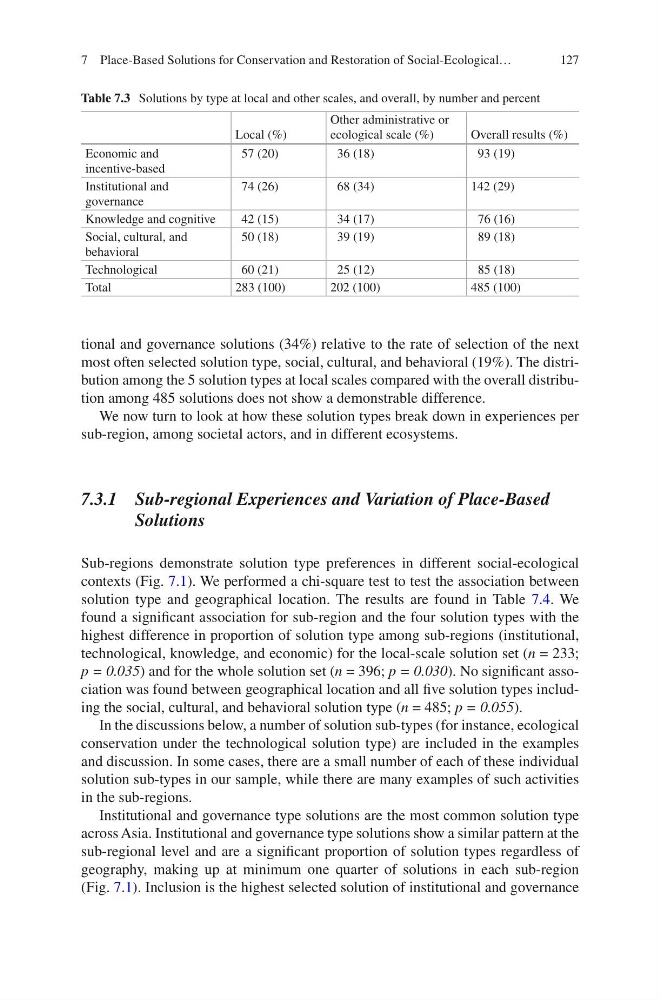
tional and governance solutions (34%) relative to the rate of selection of the next
most often selected solution type, social, cultural, and behavioral (19%). The distribution among the 5 solution types at local scales compared with the overall distribution among 485 solutions does not show a demonstrable difference.
We now turn to look at how these solution types break down in experiences per
sub-region, among societal actors, and in different ecosystems.
7.3.1 Sub-regional Experiences and Variation of Place-Based
Solutions
Sub-regions demonstrate solution type preferences in different social-ecological
contexts (Fig. 7.1). We performed a chi-square test to test the association between
solution type and geographical location. The results are found in Table 7.4. We
found a significant association for sub-region and the four solution types with the
highest difference in proportion of solution type among sub-regions (institutional,
technological, knowledge, and economic) for the local-scale solution set (n = 233;
p = 0.035) and for the whole solution set (n = 396; p = 0.030). No significant association was found between geographical location and all five solution types including the social, cultural, and behavioral solution type (n = 485; p = 0.055).
In the discussions below, a number of solution sub-types (for instance, ecological
conservation under the technological solution type) are included in the examples
and discussion. In some cases, there are a small number of each of these individual
solution sub-types in our sample, while there are many examples of such activities
in the sub-regions.
Institutional and governance type solutions are the most common solution type
across Asia. Institutional and governance type solutions show a similar pattern at the
sub-regional level and are a significant proportion of solution types regardless of
geography, making up at minimum one quarter of solutions in each sub-region
(Fig. 7.1). Inclusion is the highest selected solution of institutional and governance
Table 7.3 Solutions by type at local and other scales, and overall, by number and percent
Local (%)
Other administrative or
ecological scale (%)
Overall results (%)
Economic and
incentive-based
57 (20)
36 (18)
93 (19)
Institutional and
governance
74 (26)
68 (34)
142 (29)
Knowledge and cognitive
42 (15)
34 (17)
76 (16)
Social, cultural, and
behavioral
50 (18)
39 (19)
89 (18)
Technological
60 (21)
25 (12)
85 (18)
Total
283 (100)
202 (100)
485 (100)
7 Place-Based Solutions for Conservation and Restoration of Social-Ecological…
tional and governance solutions (34%) relative to the rate of selection of the next
most often selected solution type, social, cultural, and behavioral (19%). The distribution among the 5 solution types at local scales compared with the overall distribution among 485 solutions does not show a demonstrable difference.
We now turn to look at how these solution types break down in experiences per
sub-region, among societal actors, and in different ecosystems.
7.3.1 Sub-regional Experiences and Variation of Place-Based
Solutions
Sub-regions demonstrate solution type preferences in different social-ecological
contexts (Fig. 7.1). We performed a chi-square test to test the association between
solution type and geographical location. The results are found in Table 7.4. We
found a significant association for sub-region and the four solution types with the
highest difference in proportion of solution type among sub-regions (institutional,
technological, knowledge, and economic) for the local-scale solution set (n = 233;
p = 0.035) and for the whole solution set (n = 396; p = 0.030). No significant association was found between geographical location and all five solution types including the social, cultural, and behavioral solution type (n = 485; p = 0.055).
In the discussions below, a number of solution sub-types (for instance, ecological
conservation under the technological solution type) are included in the examples
and discussion. In some cases, there are a small number of each of these individual
solution sub-types in our sample, while there are many examples of such activities
in the sub-regions.
Institutional and governance type solutions are the most common solution type
across Asia. Institutional and governance type solutions show a similar pattern at the
sub-regional level and are a significant proportion of solution types regardless of
geography, making up at minimum one quarter of solutions in each sub-region
(Fig. 7.1). Inclusion is the highest selected solution of institutional and governance
Table 7.3 Solutions by type at local and other scales, and overall, by number and percent
Local (%)
Other administrative or
ecological scale (%)
Overall results (%)
Economic and
incentive-based
57 (20)
36 (18)
93 (19)
Institutional and
governance
74 (26)
68 (34)
142 (29)
Knowledge and cognitive
42 (15)
34 (17)
76 (16)
Social, cultural, and
behavioral
50 (18)
39 (19)
89 (18)
Technological
60 (21)
25 (12)
85 (18)
Total
283 (100)
202 (100)
485 (100)
7 Place-Based Solutions for Conservation and Restoration of Social-Ecological…