

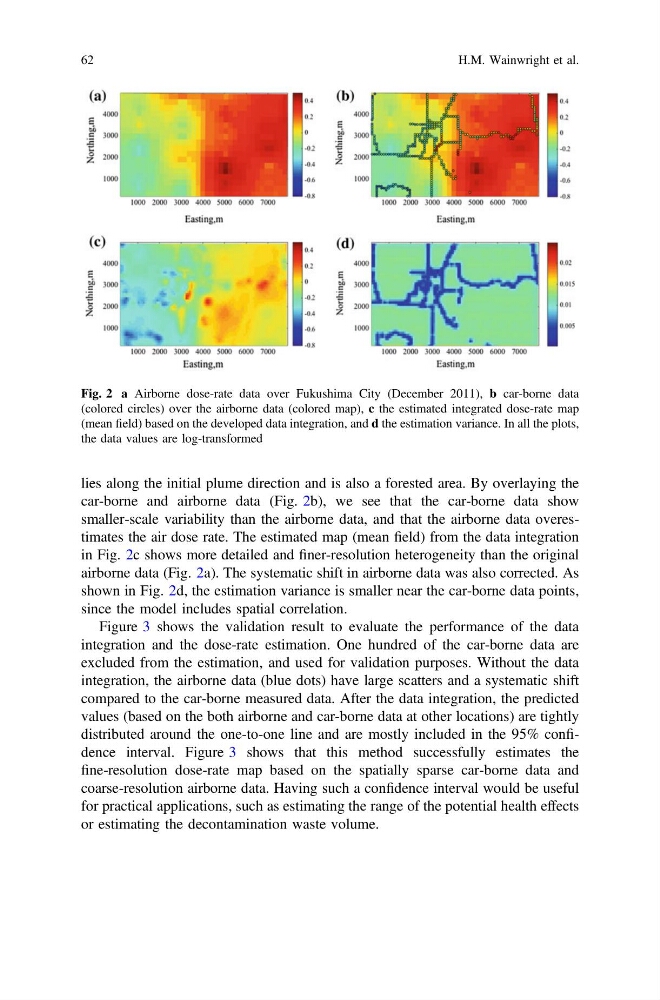
lies along the initial plume direction and is also a forested area. By overlaying the
car-borne and airborne data (Fig. 2b), we see that the car-borne data show
smaller-scale variability than the airborne data, and that the airborne data overestimates the air dose rate. The estimated map (mean field) from the data integration
in Fig. 2c shows more detailed and finer-resolution heterogeneity than the original
airborne data (Fig. 2a). The systematic shift in airborne data was also corrected. As
shown in Fig. 2d, the estimation variance is smaller near the car-borne data points,
since the model includes spatial correlation.
Figure 3 shows the validation result to evaluate the performance of the data
integration and the dose-rate estimation. One hundred of the car-borne data are
excluded from the estimation, and used for validation purposes. Without the data
integration, the airborne data (blue dots) have large scatters and a systematic shift
compared to the car-borne measured data. After the data integration, the predicted
values (based on the both airborne and car-borne data at other locations) are tightly
distributed around the one-to-one line and are mostly included in the 95% confidence interval. Figure 3 shows that this method successfully estimates the
fine-resolution dose-rate map based on the spatially sparse car-borne data and
coarse-resolution airborne data. Having such a confidence interval would be useful
for practical applications, such as estimating the range of the potential health effects
or estimating the decontamination waste volume.
Fig. 2 a Airborne dose-rate data over Fukushima City (December 2011), b car-borne data
(colored circles) over the airborne data (colored map), c the estimated integrated dose-rate map
(mean field) based on the developed data integration, and d the estimation variance. In all the plots,
the data values are log-transformed
62
H.M. Wainwright et al.
car-borne and airborne data (Fig. 2b), we see that the car-borne data show
smaller-scale variability than the airborne data, and that the airborne data overestimates the air dose rate. The estimated map (mean field) from the data integration
in Fig. 2c shows more detailed and finer-resolution heterogeneity than the original
airborne data (Fig. 2a). The systematic shift in airborne data was also corrected. As
shown in Fig. 2d, the estimation variance is smaller near the car-borne data points,
since the model includes spatial correlation.
Figure 3 shows the validation result to evaluate the performance of the data
integration and the dose-rate estimation. One hundred of the car-borne data are
excluded from the estimation, and used for validation purposes. Without the data
integration, the airborne data (blue dots) have large scatters and a systematic shift
compared to the car-borne measured data. After the data integration, the predicted
values (based on the both airborne and car-borne data at other locations) are tightly
distributed around the one-to-one line and are mostly included in the 95% confidence interval. Figure 3 shows that this method successfully estimates the
fine-resolution dose-rate map based on the spatially sparse car-borne data and
coarse-resolution airborne data. Having such a confidence interval would be useful
for practical applications, such as estimating the range of the potential health effects
or estimating the decontamination waste volume.
Fig. 2 a Airborne dose-rate data over Fukushima City (December 2011), b car-borne data
(colored circles) over the airborne data (colored map), c the estimated integrated dose-rate map
(mean field) based on the developed data integration, and d the estimation variance. In all the plots,
the data values are log-transformed
62
H.M. Wainwright et al.