

4 Summary and Future Work
In this chapter, we described a multiscale hierarchical Bayesian method for integrating multiscale, multitype dose-rate measurements. As an example, we illustrated how this method could be used to integrate coarse-resolution airborne data
and fine-resolution (but sparse) car-borne data in a consistent manner, with the
estimation uncertainty quantified. Although the current example model is still
simple, results have suggested that the effective combination of ground-based data
and airborne data could provide detailed and integrated maps of radiation air dose
rates at regional scale around the Fukushima Daiichi NPP. In addition, this method
could quantify estimation errors or confidence intervals, representing the uncertainty associated with the integrated maps. We also showed that statistical analyses
could provide various insights into both the characteristics of each dataset and the
spatial trend of contamination, which would be useful for predicting future radiation
levels at the regional scale.
Further improvement was made to improve the estimation approach by
including other information, such as the correlations between dose rates and land
use and/or topography [11]. Physics-based radiation transport models are used to
replace the spatial averaging function to accurately represent airborne data [11]. In
the future,spatiotemporal integration—by integrating spatially sparse but
continuous-time monitoring data and temporally sparse but spatially extensive data,
such as airborne data—will be carried out to provide a detailed map of the air dose
rate and radionuclide contamination at regional scale, at any given location and
time, including their confidence interval.
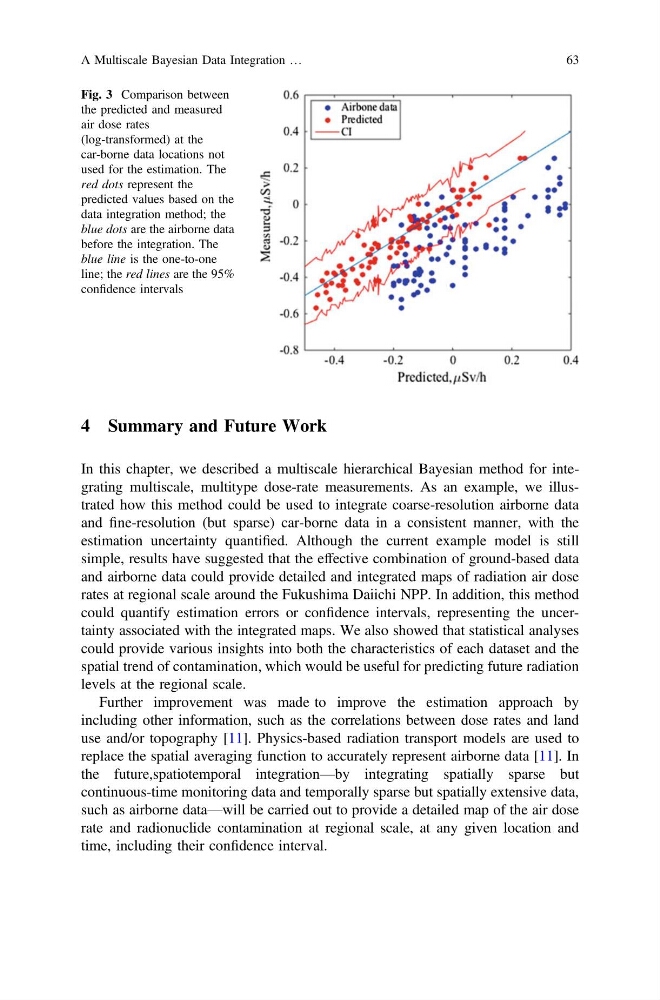
Fig. 3 Comparison between
the predicted and measured
air dose rates
(log-transformed) at the
car-borne data locations not
used for the estimation. The
red dots represent the
predicted values based on the
data integration method; the
blue dots are the airborne data
before the integration. The
blue line is the one-to-one
line; the red lines are the 95%
confidence intervals
A Multiscale Bayesian Data Integration …
63
In this chapter, we described a multiscale hierarchical Bayesian method for integrating multiscale, multitype dose-rate measurements. As an example, we illustrated how this method could be used to integrate coarse-resolution airborne data
and fine-resolution (but sparse) car-borne data in a consistent manner, with the
estimation uncertainty quantified. Although the current example model is still
simple, results have suggested that the effective combination of ground-based data
and airborne data could provide detailed and integrated maps of radiation air dose
rates at regional scale around the Fukushima Daiichi NPP. In addition, this method
could quantify estimation errors or confidence intervals, representing the uncertainty associated with the integrated maps. We also showed that statistical analyses
could provide various insights into both the characteristics of each dataset and the
spatial trend of contamination, which would be useful for predicting future radiation
levels at the regional scale.
Further improvement was made to improve the estimation approach by
including other information, such as the correlations between dose rates and land
use and/or topography [11]. Physics-based radiation transport models are used to
replace the spatial averaging function to accurately represent airborne data [11]. In
the future,spatiotemporal integration—by integrating spatially sparse but
continuous-time monitoring data and temporally sparse but spatially extensive data,
such as airborne data—will be carried out to provide a detailed map of the air dose
rate and radionuclide contamination at regional scale, at any given location and
time, including their confidence interval.
Fig. 3 Comparison between
the predicted and measured
air dose rates
(log-transformed) at the
car-borne data locations not
used for the estimation. The
red dots represent the
predicted values based on the
data integration method; the
blue dots are the airborne data
before the integration. The
blue line is the one-to-one
line; the red lines are the 95%
confidence intervals
A Multiscale Bayesian Data Integration …
63