

5000/4688/24/255_0321_ek.pdf), as well as the airborne data from the fourth airborne monitoring survey (October 22–November 5, 2011; http://radioactivity.nsr.
go.jp/en/contents/4000/3179/24/1270_1216.pdf). We assume that the effect of
radiocesium decay is negligible between the two surveys. The airborne data were
processed and converted to the values equivalent to the dose rate one meter above
the ground surface.
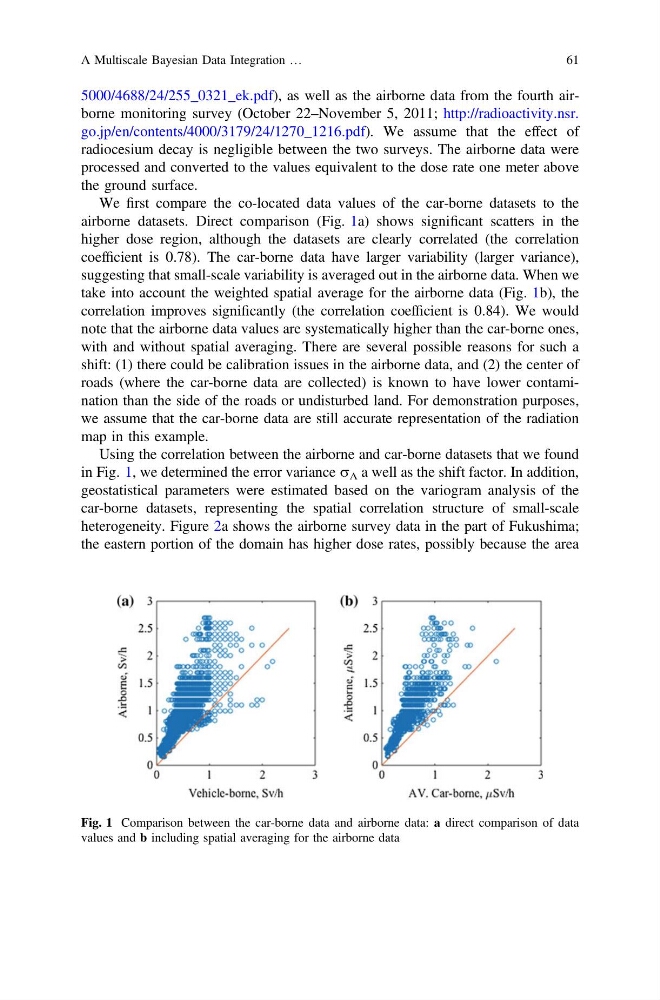
We first compare the co-located data values of the car-borne datasets to the
airborne datasets. Direct comparison (Fig. 1a) shows significant scatters in the
higher dose region, although the datasets are clearly correlated (the correlation
coefficient is 0.78). The car-borne data have larger variability (larger variance),
suggesting that small-scale variability is averaged out in the airborne data. When we
take into account the weighted spatial average for the airborne data (Fig. 1b), the
correlation improves significantly (the correlation coefficient is 0.84). We would
note that the airborne data values are systematically higher than the car-borne ones,
with and without spatial averaging. There are several possible reasons for such a
shift: (1) there could be calibration issues in the airborne data, and (2) the center of
roads (where the car-borne data are collected) is known to have lower contamination than the side of the roads or undisturbed land. For demonstration purposes,
we assume that the car-borne data are still accurate representation of the radiation
map in this example.
Using the correlation between the airborne and car-borne datasets that we found
in Fig. 1, we determined the error variance r A a well as the shift factor. In addition,
geostatistical parameters were estimated based on the variogram analysis of the
car-borne datasets, representing the spatial correlation structure of small-scale
heterogeneity. Figure 2a shows the airborne survey data in the part of Fukushima;
the eastern portion of the domain has higher dose rates, possibly because the area
Fig. 1 Comparison between the car-borne data and airborne data: a direct comparison of data
values and b including spatial averaging for the airborne data
A Multiscale Bayesian Data Integration …
61
go.jp/en/contents/4000/3179/24/1270_1216.pdf). We assume that the effect of
radiocesium decay is negligible between the two surveys. The airborne data were
processed and converted to the values equivalent to the dose rate one meter above
the ground surface.
We first compare the co-located data values of the car-borne datasets to the
airborne datasets. Direct comparison (Fig. 1a) shows significant scatters in the
higher dose region, although the datasets are clearly correlated (the correlation
coefficient is 0.78). The car-borne data have larger variability (larger variance),
suggesting that small-scale variability is averaged out in the airborne data. When we
take into account the weighted spatial average for the airborne data (Fig. 1b), the
correlation improves significantly (the correlation coefficient is 0.84). We would
note that the airborne data values are systematically higher than the car-borne ones,
with and without spatial averaging. There are several possible reasons for such a
shift: (1) there could be calibration issues in the airborne data, and (2) the center of
roads (where the car-borne data are collected) is known to have lower contamination than the side of the roads or undisturbed land. For demonstration purposes,
we assume that the car-borne data are still accurate representation of the radiation
map in this example.
Using the correlation between the airborne and car-borne datasets that we found
in Fig. 1, we determined the error variance r A a well as the shift factor. In addition,
geostatistical parameters were estimated based on the variogram analysis of the
car-borne datasets, representing the spatial correlation structure of small-scale
heterogeneity. Figure 2a shows the airborne survey data in the part of Fukushima;
the eastern portion of the domain has higher dose rates, possibly because the area
Fig. 1 Comparison between the car-borne data and airborne data: a direct comparison of data
values and b including spatial averaging for the airborne data
A Multiscale Bayesian Data Integration …
61