

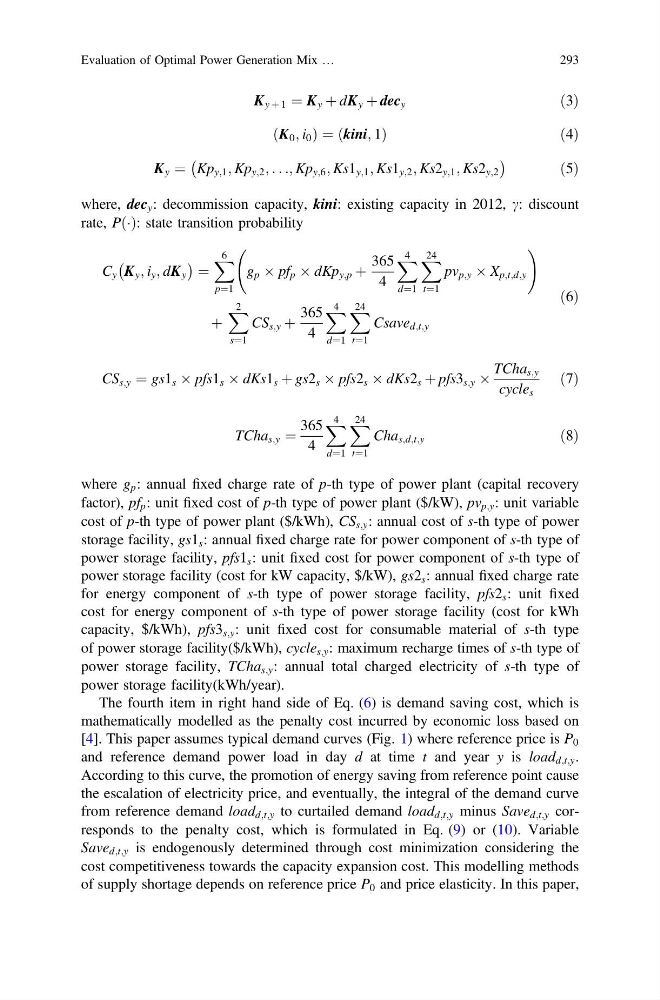
K y þ 1 ¼ K y þ dK y þ dec y
ð3Þ
K 0 ; i 0
ð
Þ¼ kini; 1
ð
Þ
ð4Þ
K y ¼ Kp y;1 ; Kp y;2 ; . . .; Kp y;6 ; Ks1 y;1 ; Ks1 y;2 ; Ks2 y;1 ; Ks2 y;2
À
Á
ð5Þ
where, dec y : decommission capacity, kini: existing capacity in 2012, c: discount
rate, P Á
ð Þ: state transition probability
C y K y ; i y ; dK y
À
Á ¼
X 6
p¼1
g p  pf p  dKp y;p þ
365
4
X 4
d¼1
X 24
t¼1
pv p;y  X p;t;d;y
!
þ
X 2
s¼1
CS s;y þ
365
4
X 4
d¼1
X 24
t¼1
Csave d;t;y
ð6Þ
CS s;y ¼ gs1 s  pfs1 s  dKs1 s þ gs2 s  pfs2 s  dKs2 s þ pfs3 s;y Â
TCha s;y
cycle s
ð7Þ
TCha s;y ¼
365
4
X 4
d¼1
X 24
t¼1
Cha s;d;t;y
ð8Þ
where g p : annual fixed charge rate of p-th type of power plant (capital recovery
factor), pf p : unit fixed cost of p-th type of power plant ($/kW), pv p;y : unit variable
cost of p-th type of power plant ($/kWh), CS s;y : annual cost of s-th type of power
storage facility, gs1 s : annual fixed charge rate for power component of s-th type of
power storage facility, pfs1 s : unit fixed cost for power component of s-th type of
power storage facility (cost for kW capacity, $/kW), gs2 s : annual fixed charge rate
for energy component of s-th type of power storage facility, pfs2 s : unit fixed
cost for energy component of s-th type of power storage facility (cost for kWh
capacity, $/kWh), pfs3 s;y : unit fixed cost for consumable material of s-th type
of power storage facility($/kWh), cycle s;y : maximum recharge times of s-th type of
power storage facility, TCha s;y : annual total charged electricity of s-th type of
power storage facility(kWh/year).
The fourth item in right hand side of Eq. (6) is demand saving cost, which is
mathematically modelled as the penalty cost incurred by economic loss based on
[4]. This paper assumes typical demand curves (Fig. 1) where reference price is P 0
and reference demand power load in day d at time t and year y is load d;t;y .
According to this curve, the promotion of energy saving from reference point cause
the escalation of electricity price, and eventually, the integral of the demand curve
from reference demand load d;t;y to curtailed demand load d;t;y minus Save d;t;y corresponds to the penalty cost, which is formulated in Eq. (9) or (10). Variable
Save d;t;y is endogenously determined through cost minimization considering the
cost competitiveness towards the capacity expansion cost. This modelling methods
of supply shortage depends on reference price P 0 and price elasticity. In this paper,
Evaluation of Optimal Power Generation Mix …
293
ð3Þ
K 0 ; i 0
ð
Þ¼ kini; 1
ð
Þ
ð4Þ
K y ¼ Kp y;1 ; Kp y;2 ; . . .; Kp y;6 ; Ks1 y;1 ; Ks1 y;2 ; Ks2 y;1 ; Ks2 y;2
À
Á
ð5Þ
where, dec y : decommission capacity, kini: existing capacity in 2012, c: discount
rate, P Á
ð Þ: state transition probability
C y K y ; i y ; dK y
À
Á ¼
X 6
p¼1
g p  pf p  dKp y;p þ
365
4
X 4
d¼1
X 24
t¼1
pv p;y  X p;t;d;y
!
þ
X 2
s¼1
CS s;y þ
365
4
X 4
d¼1
X 24
t¼1
Csave d;t;y
ð6Þ
CS s;y ¼ gs1 s  pfs1 s  dKs1 s þ gs2 s  pfs2 s  dKs2 s þ pfs3 s;y Â
TCha s;y
cycle s
ð7Þ
TCha s;y ¼
365
4
X 4
d¼1
X 24
t¼1
Cha s;d;t;y
ð8Þ
where g p : annual fixed charge rate of p-th type of power plant (capital recovery
factor), pf p : unit fixed cost of p-th type of power plant ($/kW), pv p;y : unit variable
cost of p-th type of power plant ($/kWh), CS s;y : annual cost of s-th type of power
storage facility, gs1 s : annual fixed charge rate for power component of s-th type of
power storage facility, pfs1 s : unit fixed cost for power component of s-th type of
power storage facility (cost for kW capacity, $/kW), gs2 s : annual fixed charge rate
for energy component of s-th type of power storage facility, pfs2 s : unit fixed
cost for energy component of s-th type of power storage facility (cost for kWh
capacity, $/kWh), pfs3 s;y : unit fixed cost for consumable material of s-th type
of power storage facility($/kWh), cycle s;y : maximum recharge times of s-th type of
power storage facility, TCha s;y : annual total charged electricity of s-th type of
power storage facility(kWh/year).
The fourth item in right hand side of Eq. (6) is demand saving cost, which is
mathematically modelled as the penalty cost incurred by economic loss based on
[4]. This paper assumes typical demand curves (Fig. 1) where reference price is P 0
and reference demand power load in day d at time t and year y is load d;t;y .
According to this curve, the promotion of energy saving from reference point cause
the escalation of electricity price, and eventually, the integral of the demand curve
from reference demand load d;t;y to curtailed demand load d;t;y minus Save d;t;y corresponds to the penalty cost, which is formulated in Eq. (9) or (10). Variable
Save d;t;y is endogenously determined through cost minimization considering the
cost competitiveness towards the capacity expansion cost. This modelling methods
of supply shortage depends on reference price P 0 and price elasticity. In this paper,
Evaluation of Optimal Power Generation Mix …
293